Copyright
©2014 Baishideng Publishing Group Inc.
World J Gastroenterol. Nov 14, 2014; 20(42): 15925-15930
Published online Nov 14, 2014. doi: 10.3748/wjg.v20.i42.15925
Published online Nov 14, 2014. doi: 10.3748/wjg.v20.i42.15925
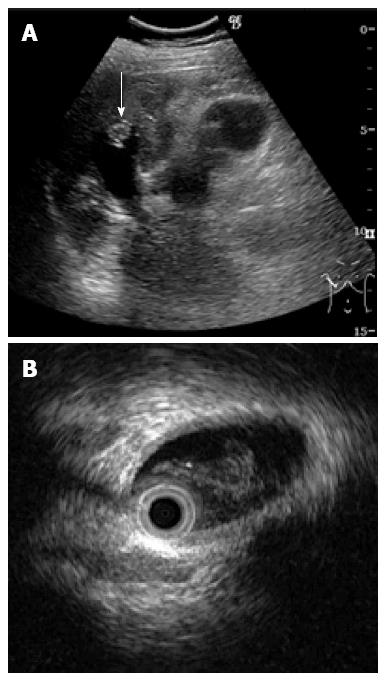
Figure 1 Ultrasonogram demonstrating a hyper-echoic lesion (arrow) in a dilated posterior bile duct of the right lobe (A), Intraductal ultrasonography demonstrates the presence of hypo-echoic material, that was considered likely to be mucin (B).
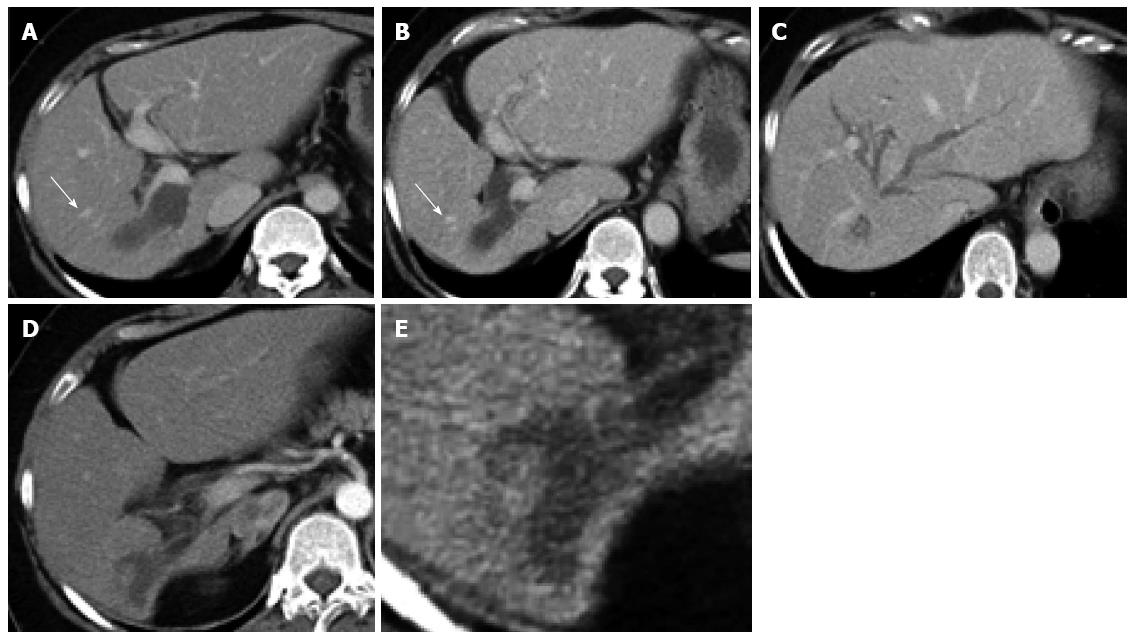
Figure 2 Abdominal computed tomography scan shows expansion of the bilateral intrahepatic bile duct.
The right lobe has atrophied and the left lobe is enlarged. A posterior branch has expanded in the shape of a cyst. A: 18 mo before surgery; B-E: Enhanced computed tomography (arrow: Middle hepatic vein).
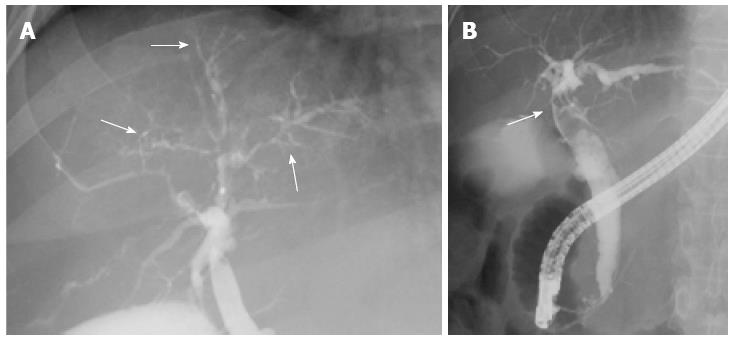
Figure 3 Intrahepatic bile duct shows narrowing, which created asymmetry with a withered branch-like appearance (A) (arrow); Endoscopic retrograde cholangiography shows a filling defect in the common bile duct (B) (arrow).
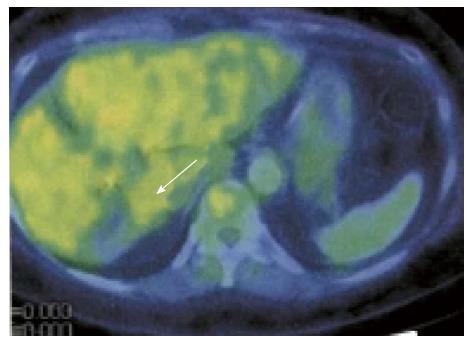
Figure 4 No area shows abnormal uptake of FDG (arrow).
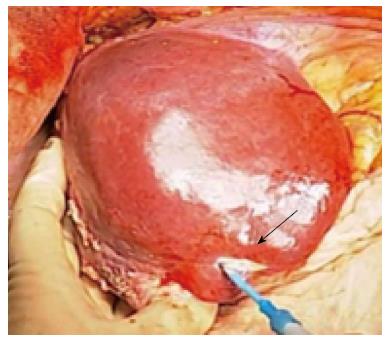
Figure 5 Right liver appears to be atrophic (arrow, demarcation line).
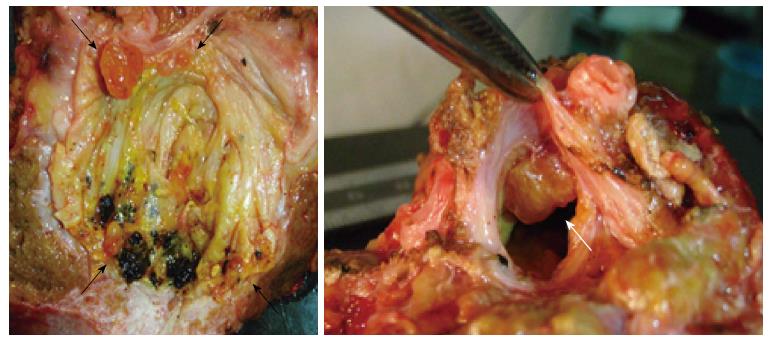
Figure 6 Intrahepatic large bile duct in the right lobe is filled with mucin and shows several yellowish-tan papillary tumors (arrow).
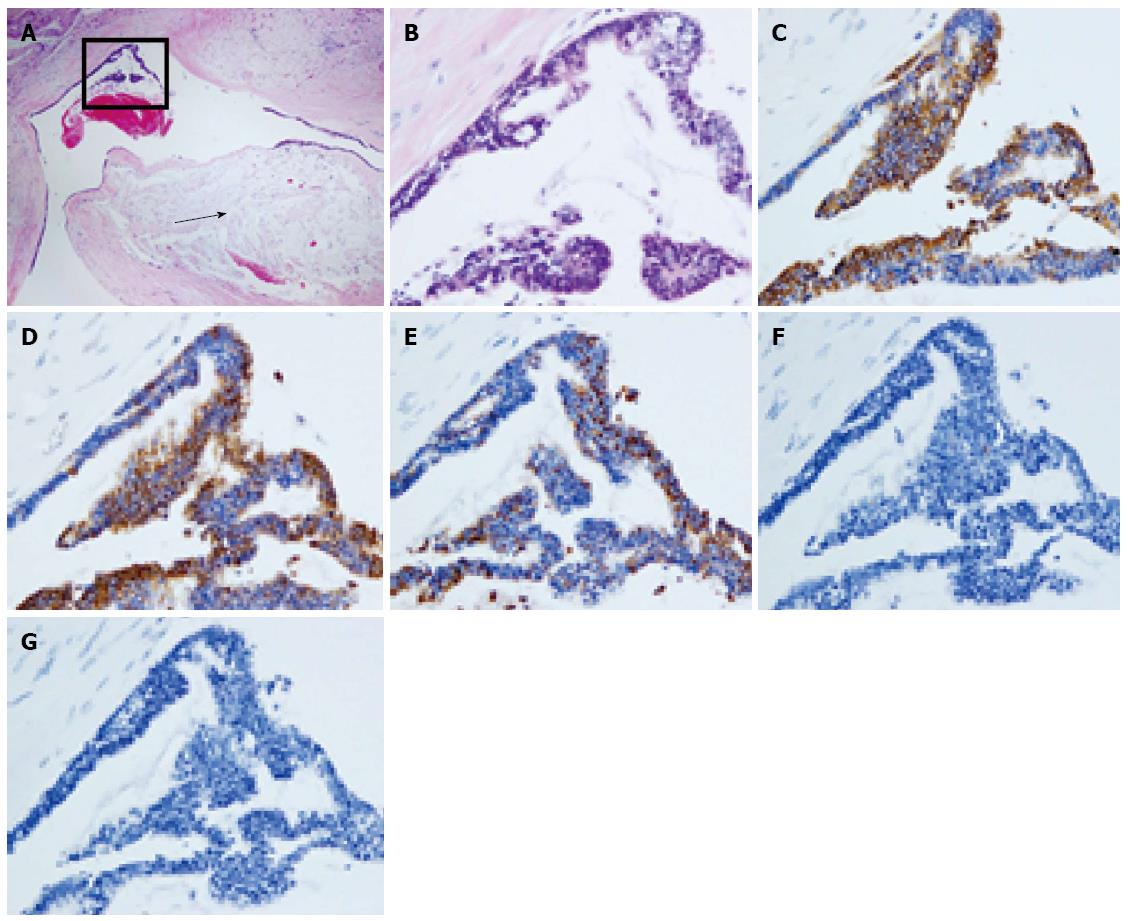
Figure 7 Tumors have proliferated and have a partly papillary appearance.
A: Secreting mucin into the parenchyma (arrow) (HE stain × 40); B: HE × 200; C: CK7 positive; D: CK20 positive; E: MUC2 positive; F: MUC5AC negative; G: MUC6 negative.
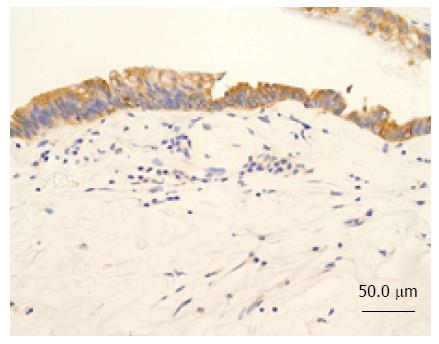
Figure 8 Neoplastic cells were histologically classed as the intestinal type.
CK7 negative in the parenchyma (× 200).
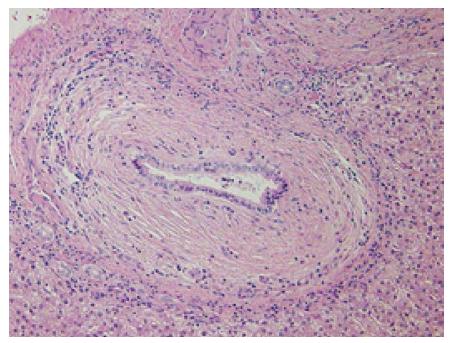
Figure 9 Periductal concentric fibrosis of the bile ducts was present.
Onion skin-like appearance, × 200.
- Citation: Hachiya H, Kita J, Shiraki T, Iso Y, Shimoda M, Kubota K. Intraductal papillary neoplasm of the bile duct developing in a patient with primary sclerosing cholangitis: A case report. World J Gastroenterol 2014; 20(42): 15925-15930
- URL: https://www.wjgnet.com/1007-9327/full/v20/i42/15925.htm
- DOI: https://dx.doi.org/10.3748/wjg.v20.i42.15925


