Copyright
©2014 Baishideng Publishing Group Inc.
World J Gastroenterol. Nov 14, 2014; 20(42): 15736-15744
Published online Nov 14, 2014. doi: 10.3748/wjg.v20.i42.15736
Published online Nov 14, 2014. doi: 10.3748/wjg.v20.i42.15736
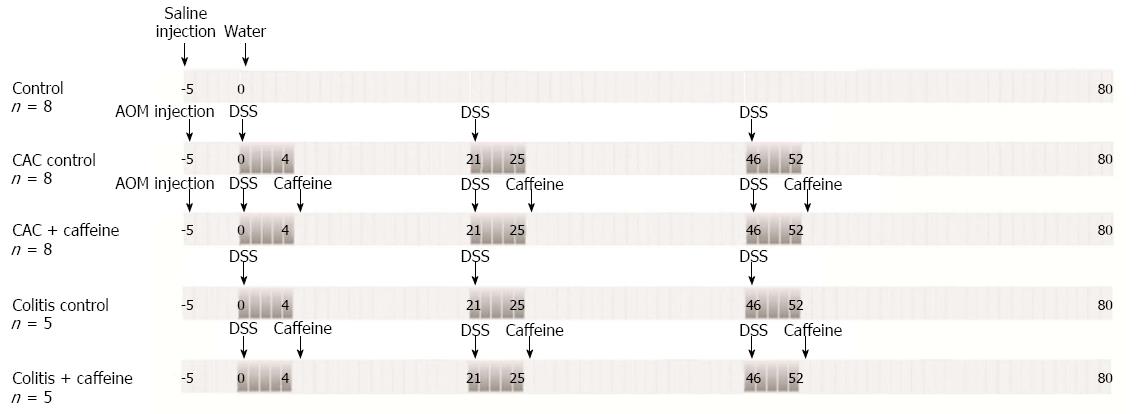
Figure 1 Outline of the protocol in the murine model of colitis-associated carcinoma and chronic colitis.
AOM (12 mg/kg) plus 3 cycles of DSS (3%) with or without caffeine (2.5 mmol/L) was introduced to animals in the CAC group (8 mice/group). Animals in the colitis group were administered 3 cycles of DSS with or without caffeine (5 mice/group). AOM: Azoxymethane; DSS: Dextran sulfate sodium; CAC: Colitis-associated carcinoma.
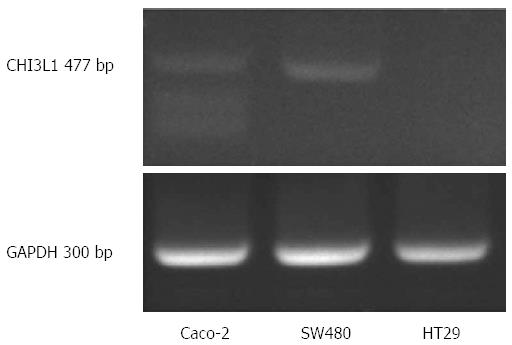
Figure 2 HT-29 cells do not express chitinase 3-like-1 constitutively.
CHI3L1: Chitinase 3-like-1.
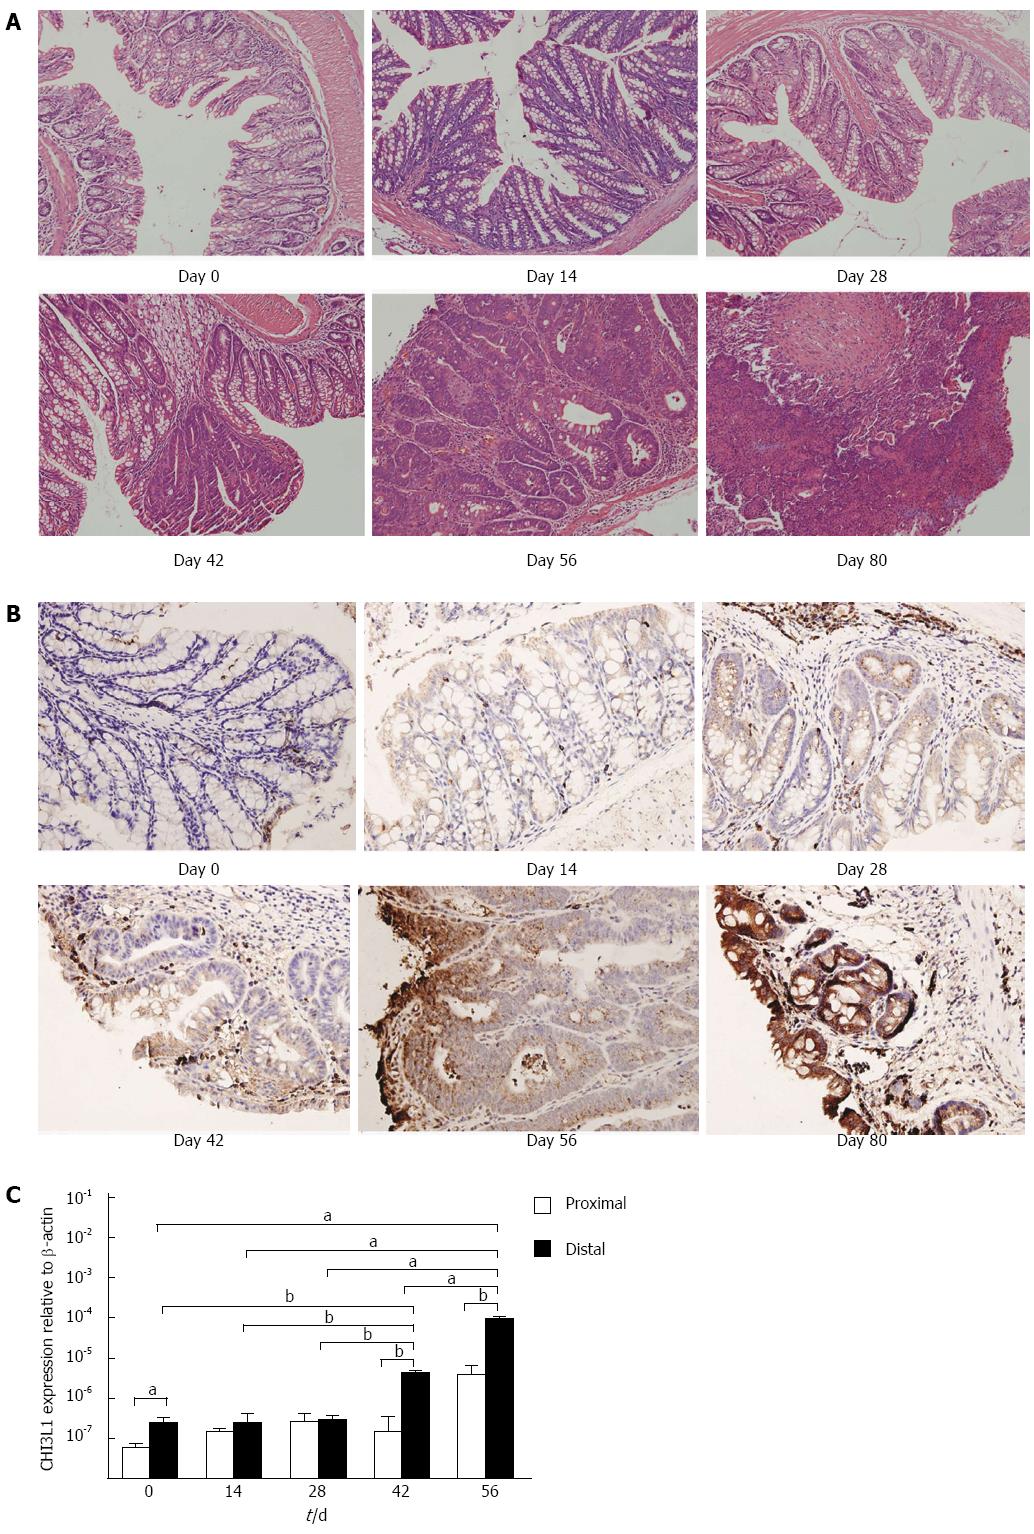
Figure 3 Chitinase 3-like-1 is up-regulated during the progression of carcinogenesis.
A: Histological changes after AOM/DSS administration (HE staining, objective, 20 ×); B, C: CHI3L1 expression increased during the progression of colon carcinogenesis (B: Immunohistochemistry staining, objective, 40 ×). In Figure C, data represent mean ± SD. n = 3 at each time point. aP < 0.05 distal: day 56 vs day 0, 14, 28 and 42; bP < 0.01 distal: day 42 vs day 0, 14, 28; distal vs proximal. AOM: Azoxymethane; DSS: Dextran sulfate sodium; CAC: Colitis-associated carcinoma; CHI3L1: Chitinase 3-like-1.
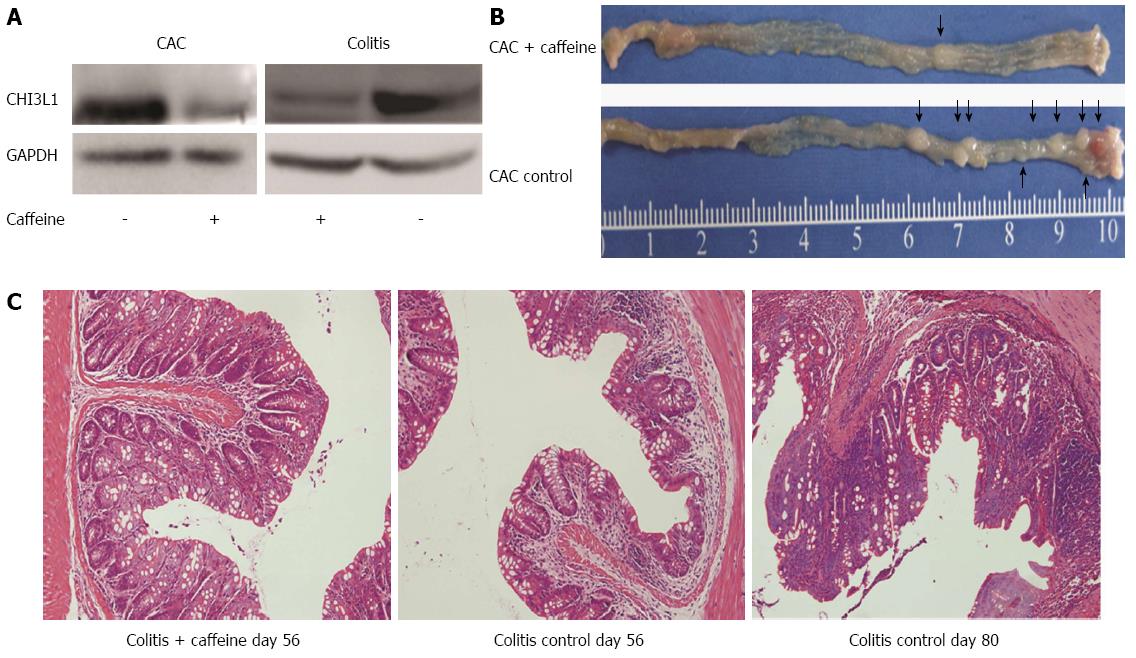
Figure 4 Chitinase 3-like-1 inhibition may be one of the underlying mechanisms in the protective effect of caffeine.
A: Caffeine suppresses CHI3L1 expression in both the CAC group and colitis group; B: Macroscopic overview of representative colonic samples from the CAC control group and the CAC + caffeine group; C: HE staining of colonic specimens from the colitis control group and caffeine-treated group (objective, 20 ×). CAC: Colitis-associated carcinoma; CHI3L1: Chitinase 3-like-1.
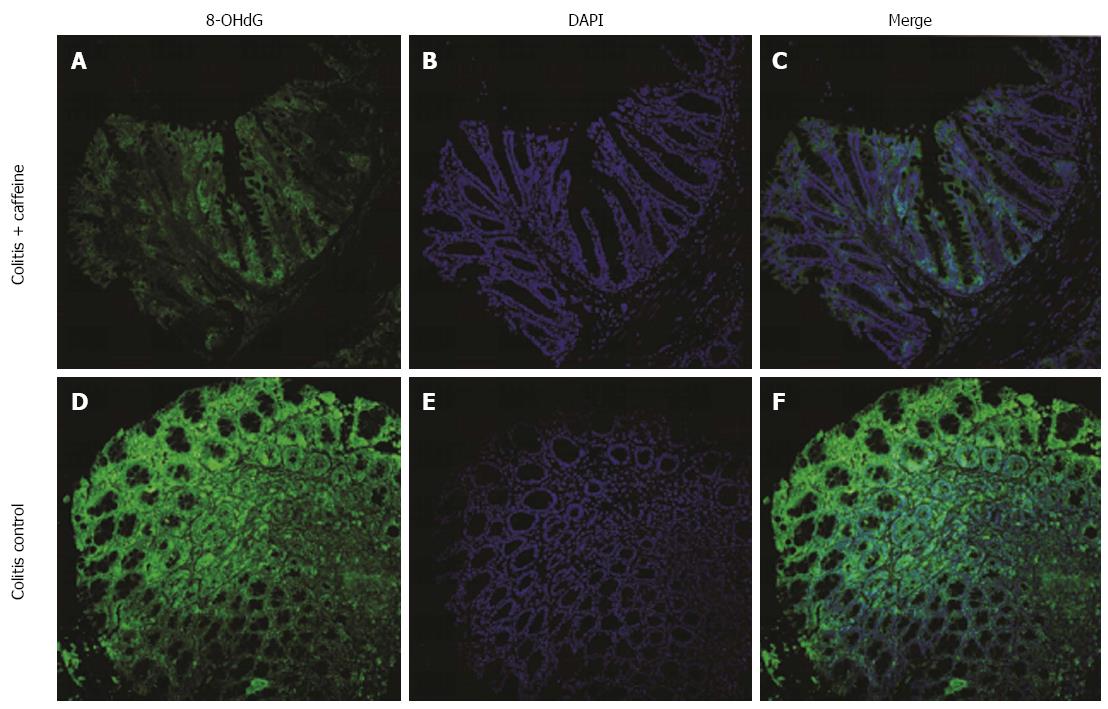
Figure 5 Immunofluorescence images of 8-hydroxyguanine expression in colon samples.
Comparison of 8-OHdG expression in mice from the colitis control group and the colitis + caffeine group are shown (objective, 20 ×). 8-OHdG: 8-hydroxyguanine.
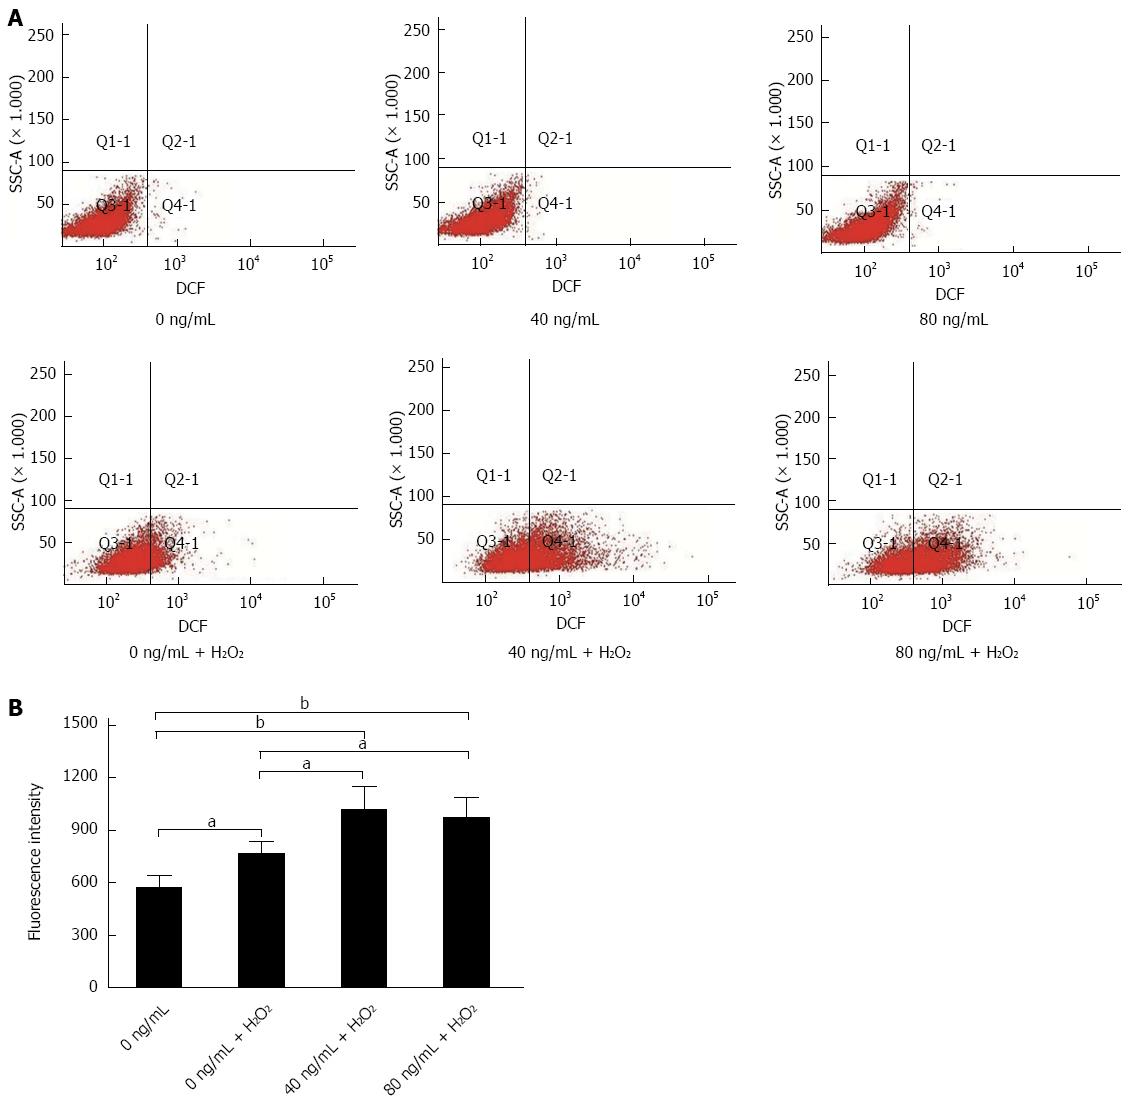
Figure 6 Recombinant chitinase 3-like-1 protein enhanced reactive oxygen species in HT29 cells.
A, B: Flow cytometer results of ROS level in HT29 cells (A top: Without H2O2 challenge; A bottom: With H2O2 challenge). Data represent mean ± SD. aP < 0.05, 0 ng/mL + H2O2vs 0 ng/mL, 40 ng/mL + H2O2, 80 ng/mL + H2O2; bP < 0.01, 0 ng/mL vs 40 ng/mL + H2O2, 80 ng/mL + H2O2. ROS: Reactive oxygen species.
- Citation: Ma JY, Li RH, Huang K, Tan G, Li C, Zhi FC. Increased expression and possible role of chitinase 3-like-1 in a colitis-associated carcinoma model. World J Gastroenterol 2014; 20(42): 15736-15744
- URL: https://www.wjgnet.com/1007-9327/full/v20/i42/15736.htm
- DOI: https://dx.doi.org/10.3748/wjg.v20.i42.15736


