Copyright
©2014 Baishideng Publishing Group Inc.
World J Gastroenterol. Oct 7, 2014; 20(37): 13625-13631
Published online Oct 7, 2014. doi: 10.3748/wjg.v20.i37.13625
Published online Oct 7, 2014. doi: 10.3748/wjg.v20.i37.13625
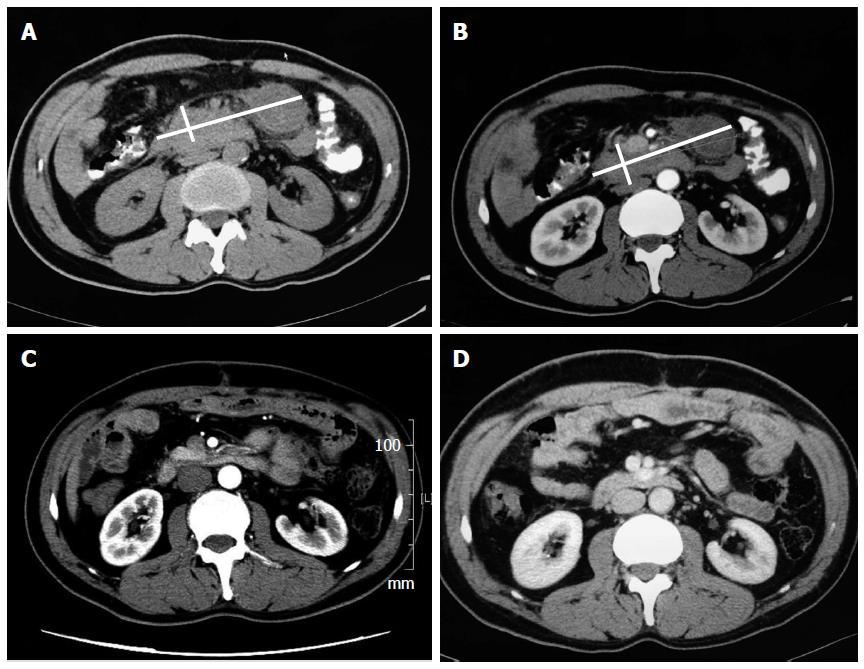
Figure 1 Computed tomography imaging changes of patient No.
1 A: A plain computed tomography (CT) scan on admission showing a large nodular mass (white lines mark the maximum and minimum diameter) located in the upper quadrant of the peritoneum and encasing the surrounding soft tissues; B: An enhancement CT scan showing the mass to be multinodular. Some parts of the mass were mildly enhanced, while others were cystic degenerated; C: A CT scan obtained 3 wk after the operation identified the spontaneous regression of the tumor; D: A CT scan obtained 3 mo later did not show any indication of relapse.
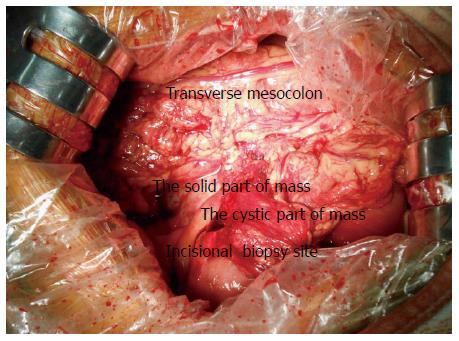
Figure 2 Intraoperative photograph of patient No.
1. A solid-cystic mass was discovered invading adjacent organs and tissues during exploration. The mass was approximately 15 cm × 8 cm in size and could not be entirely removed.
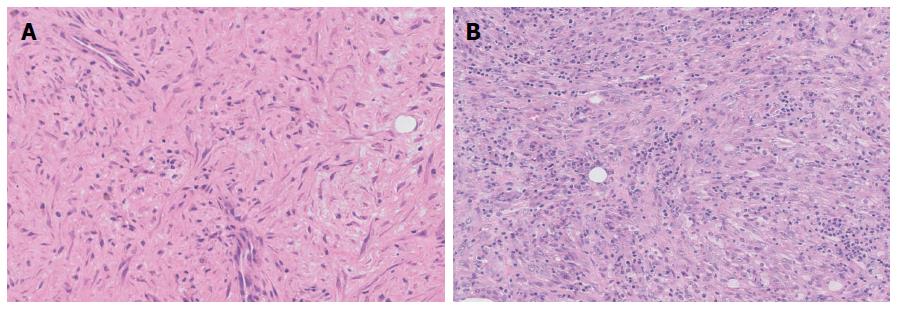
Figure 3 Pathological images of two patients.
A: Histological examination showing a proliferation of myofibroblasts and infiltration of inflammation cells (HE stain, 200 ×); B: Histological examination showing a proliferation of spindled cells, likely myofibroblasts, mixed with abundant lymphocytes and plasma cells (HE stain, 200 ×).
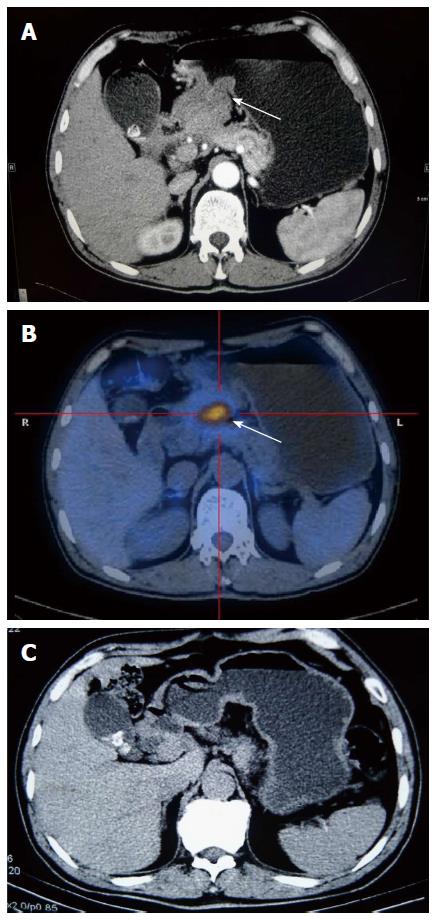
Figure 4 Computed tomography/positron emission tomography-computer tomography imaging changes of patient No.
2. A: A computed tomography (CT) scan on admission showed that the gastric wall at the antrum was clearly thickened and enhanced (white arrow) in the arterial phase. Several lymph nodes could also be observed, the biggest one being approximately 3.9 cm in diameter; B: A positron emission tomography-computer tomography on admission showed a high FDG (fluorodeoxyglucose) uptake mass located at the interval between the antrum and pancreas (white arrow). The maximum standardized uptake value (SUV max) was 11.7, and the retention index was 21.8%; C: A CT scan obtained 1 mo after discharge identified the spontaneous regression of the tumor.
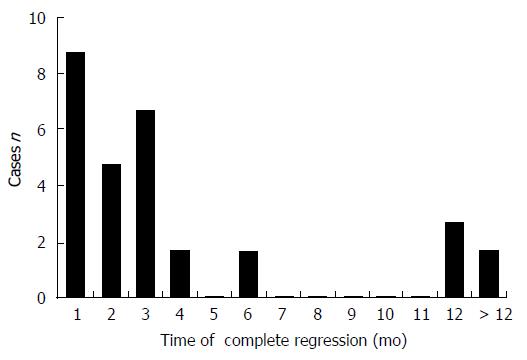
Figure 5 Time of complete regression of reported cases.
The majority of cases reported that the mass shrunk within 3 mo, and almost all patients had complete resolution in 1 year.
- Citation: Zhao JJ, Ling JQ, Fang Y, Gao XD, Shu P, Shen KT, Qin J, Sun YH, Qin XY. Intra-abdominal inflammatory myofibroblastic tumor: Spontaneous regression. World J Gastroenterol 2014; 20(37): 13625-13631
- URL: https://www.wjgnet.com/1007-9327/full/v20/i37/13625.htm
- DOI: https://dx.doi.org/10.3748/wjg.v20.i37.13625


