Copyright
©2014 Baishideng Publishing Group Inc.
World J Gastroenterol. Sep 14, 2014; 20(34): 12226-12232
Published online Sep 14, 2014. doi: 10.3748/wjg.v20.i34.12226
Published online Sep 14, 2014. doi: 10.3748/wjg.v20.i34.12226
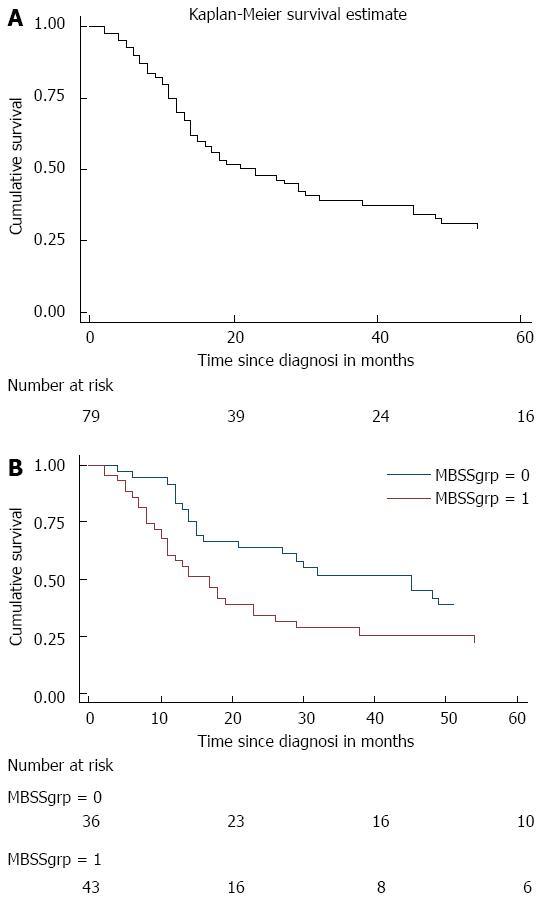
Figure 1 Kaplan-Meier survival curve.
A: Kaplan-Meier survival curve for the overall pool of subjects including numbers at risk at each time point and limited to 60 mo of analysis time; B: Kaplan-Meier survival curves of two subgroups of subjects defined by McGill Brisbane Symptom Score category and including the numbers at risk at each time point. (Log rank test for equality of survival curves, low MBSS vs high MBSS P = 0.005). MBSS: McGill Brisbane Symptom Score.
- Citation: Jamal MH, Doi SAR, Moser AJ, Dumitra S, Khalil JA, Simoneau E, Chaudhury P, Onitilo AA, Metrakos P, Barkun JS. McGill Brisbane Symptom Score for patients with resectable pancreatic head adenocarcinoma. World J Gastroenterol 2014; 20(34): 12226-12232
- URL: https://www.wjgnet.com/1007-9327/full/v20/i34/12226.htm
- DOI: https://dx.doi.org/10.3748/wjg.v20.i34.12226


