Copyright
©2014 Baishideng Publishing Group Inc.
World J Gastroenterol. Sep 14, 2014; 20(34): 12171-12181
Published online Sep 14, 2014. doi: 10.3748/wjg.v20.i34.12171
Published online Sep 14, 2014. doi: 10.3748/wjg.v20.i34.12171
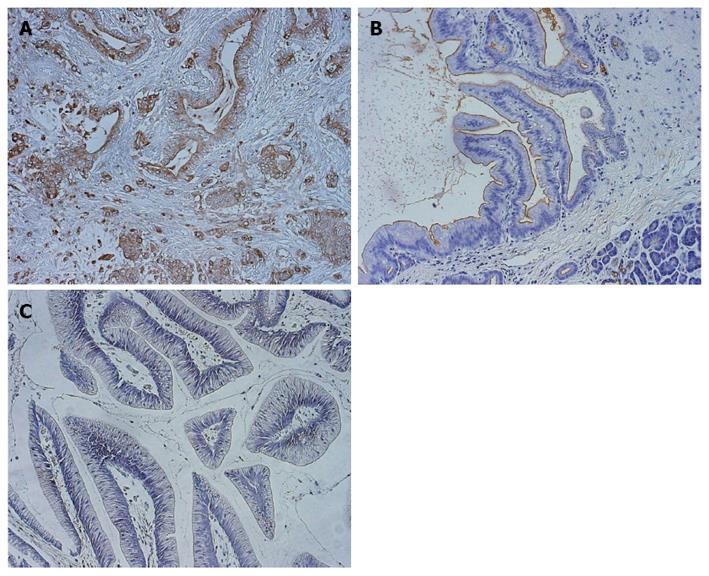
Figure 1 Immunohistochemistry for KL-6/MUC1 expression in tissue.
Staining for KL-6/MUC1 in A: Pancreatic duct cell carcinoma; B: Pancreatic duct cell carcinoma and surrounding normal tissues; C: Intraductal papillary mucinous tumor (200 × magnification).
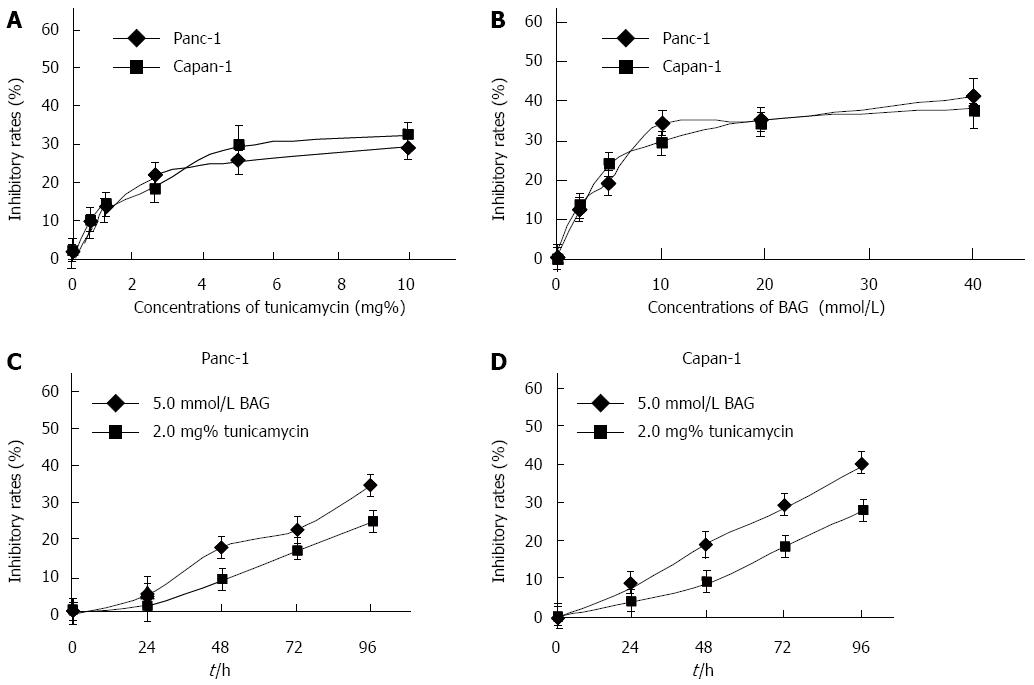
Figure 2 Effects of glycosylation inhibitors on Panc-1 and Capan-1 cell proliferation.
MTT assays were performed to assess inhibitory curves of Panc-1 and Capan-1 cells treated with different concentrations of A: Tunicamycin or B: Benzyl-N-acetyl-α-galactosaminide (BAG) for 48 h; and for various times with 2.0% tunicamycin or 5.0 mmol/L BAG in C: Panc-1 cells; or D: Capan-1 cells. MTT: 3-[4,5-dimethylthiazol-2-yl]-2,5-diphenyltetrazolium bromide.
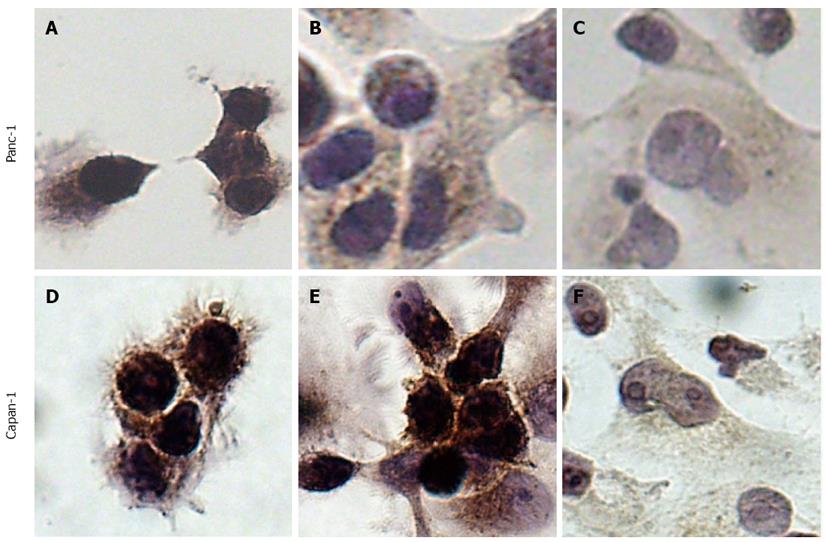
Figure 3 Immunocytochemistry for KL-6/MUC1 expression in Panc-1 and Capan-1 cells.
Staining for KL-6/MUC1 in A-C: Panc-1; or D-F: Capan-1 cells. A, D: Controls; B, E: 48 h treatment with 2.0 mg% tunicamycin; C, F: 48 h treatment with 5.0 mmol/L benzyl-N-acetyl-α-galactosaminide (800 × magnification).
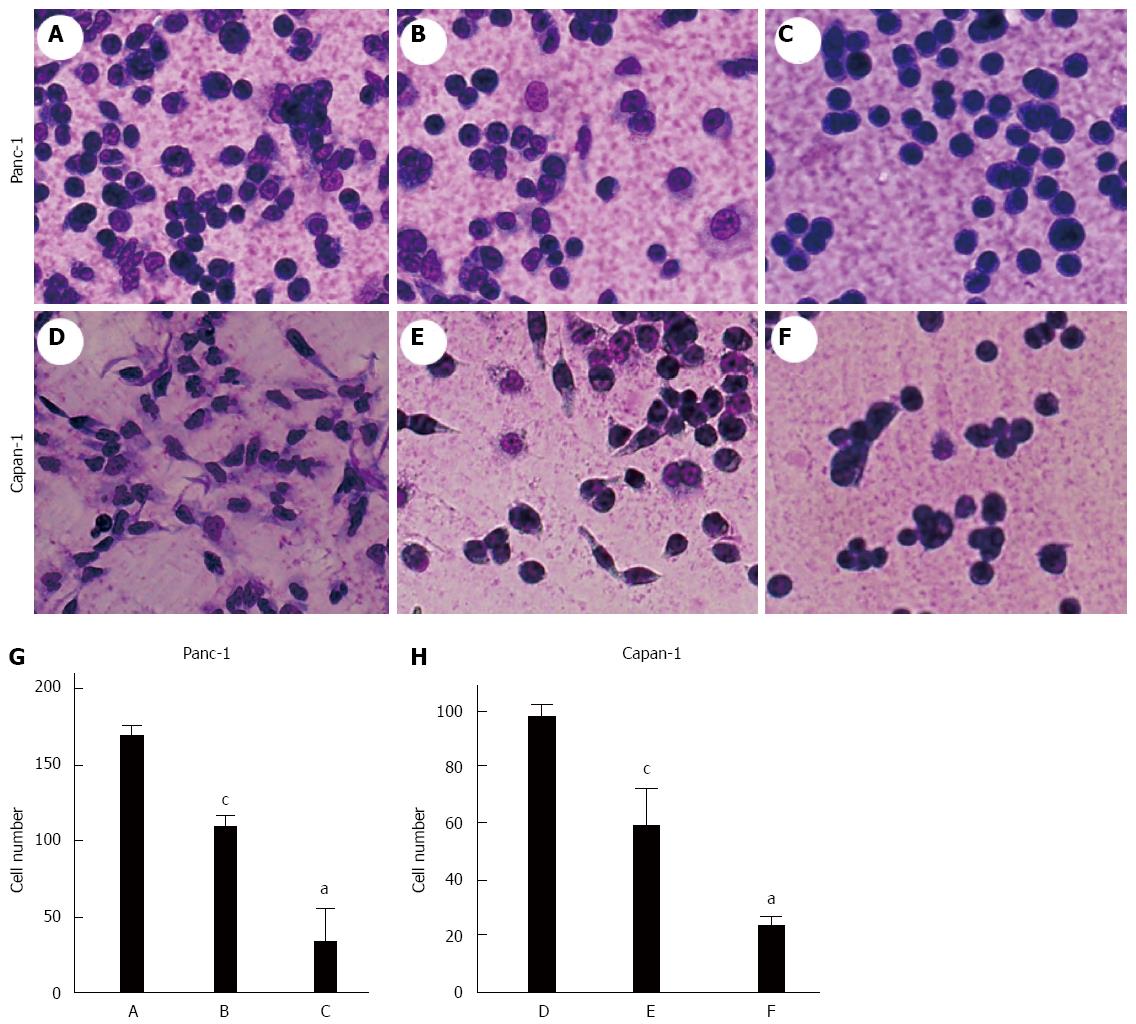
Figure 4 Effects of glycosylation inhibitors on Panc-1 and Capan-1 cell adhesion.
Microscopic images of A-C: Panc-1; or D-F: Capan-1 cells adhered to. A, D: Controls; B, E: 48 h treatment with 2.0 mg% tunicamycin; C, F: 48 h treatment with 5.0 mmol/L benzyl-N-acetyl-α-galactosaminide; G, H: Average adhered cell numbers; aP < 0.05 vs controls; cP < 0.05 vs benzyl-N-acetyl-α-galactosaminide.
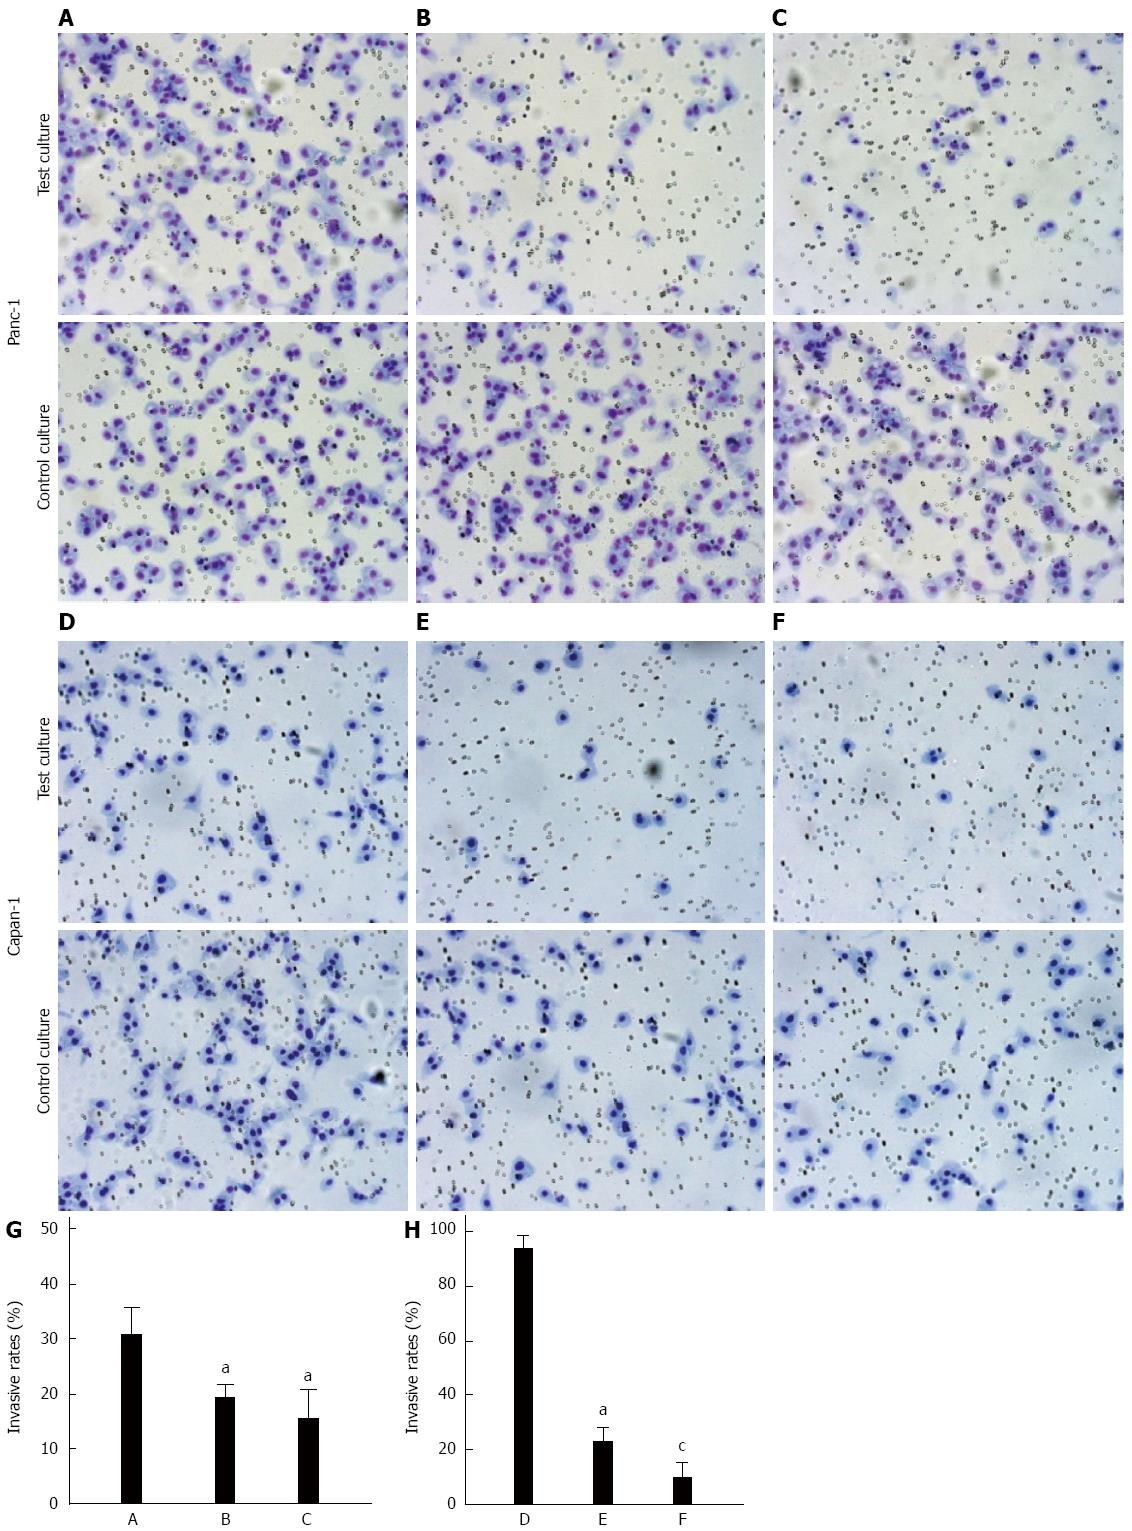
Figure 5 Effects of glycosylation inhibitors on Panc-1 and Capan-1 cell invasion.
Microscopic images of A-C: Panc-1; or D-F: Capan-1 cells. A, D: Controls; B, E: 48 h treatment with 2.0 mg% tunicamycin; C, F: 48 h treatment with 5.0 mmol/L benzyl-N-acetyl-α-galactosaminide (200 × magnification); G, H: Invasive rates; aP < 0.05 vs control; cP < 0.05 vs tunicamycin.
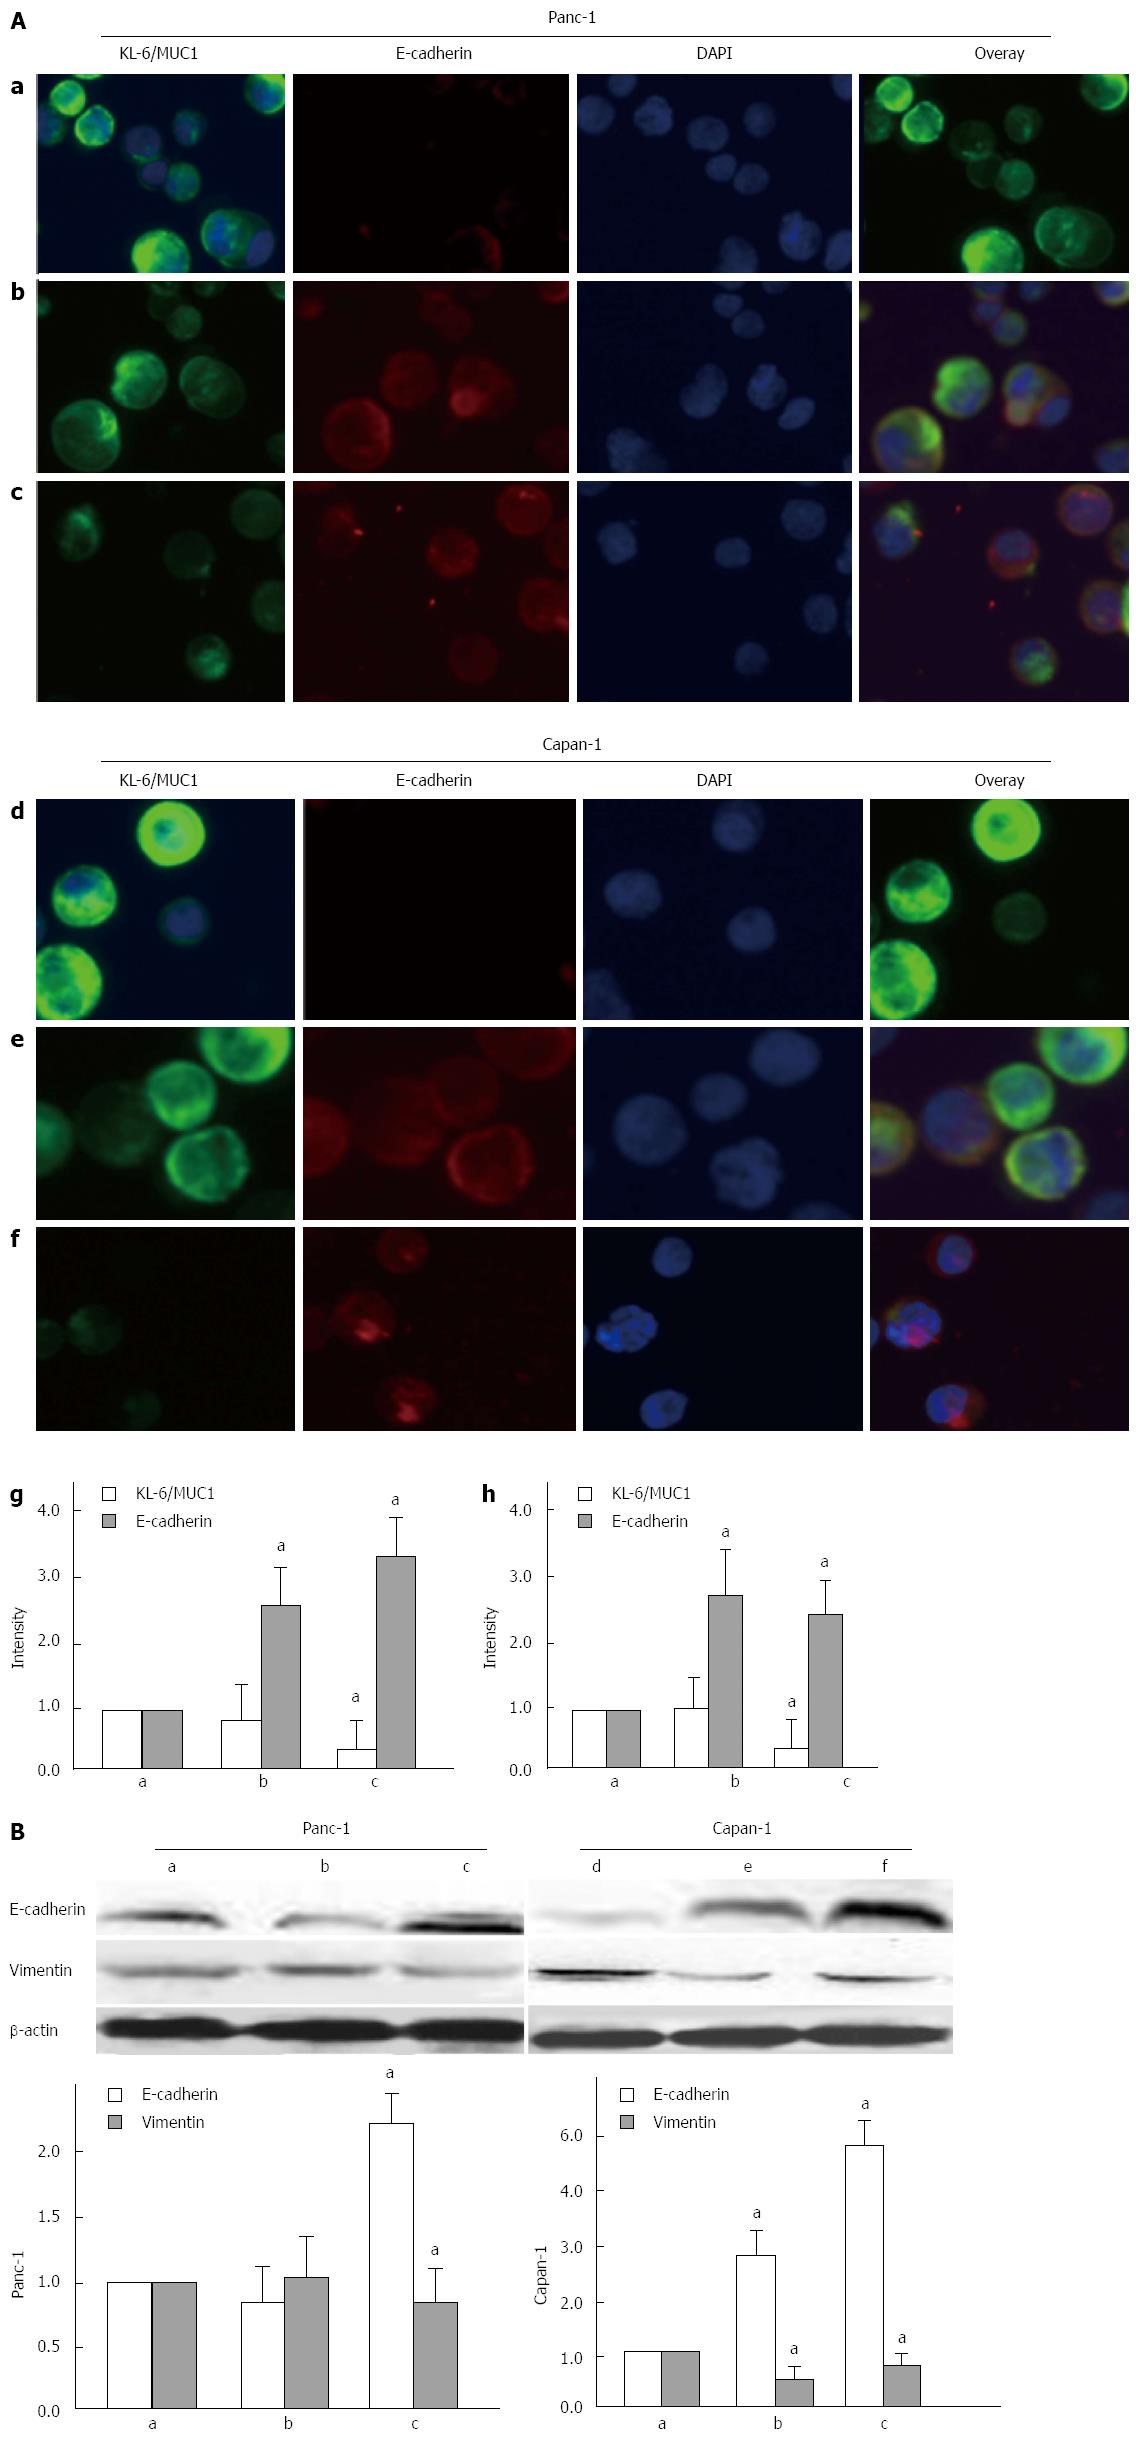
Figure 6 E-cadherin and vimentin expression in Panc-1 and Capan-1 cells.
A: Immunocytochemistry for KL-6/MUC1 and E-cadherin in: Panc-1 or Capan-1 cells pretreated with DMEM medium without drugs (a, d) or supplemented with tunicamycin (b, e) or BAG (c, f) for 48 h. (DAPI, nuclear stain, 800 × magnification), and fluorescence staining quantification(g, h); B: Western blotting and band intensity for E-cadherin and vimentin expression in Panc-1 (a, b, c) and Capan-1 (d, e, f) cells; control (a, d), 48 h treatment with 2.0 mg% tunicamycin (b, e), 48 h treatment with 5.0 mmol/L benzyl-N-acetyl-α-galactosaminide (c, f); aP < 0.05 vs control.
- Citation: Xu HL, Zhao X, Zhang KM, Tang W, Kokudo N. Inhibition of KL-6/MUC1 glycosylation limits aggressive progression of pancreatic cancer. World J Gastroenterol 2014; 20(34): 12171-12181
- URL: https://www.wjgnet.com/1007-9327/full/v20/i34/12171.htm
- DOI: https://dx.doi.org/10.3748/wjg.v20.i34.12171


