Copyright
©2014 Baishideng Publishing Group Inc.
World J Gastroenterol. Sep 7, 2014; 20(33): 11886-11893
Published online Sep 7, 2014. doi: 10.3748/wjg.v20.i33.11886
Published online Sep 7, 2014. doi: 10.3748/wjg.v20.i33.11886
Figure 1 Comparison of overall survival between S-1-based chemotherapy and non-S-1-based chemotherapy.
Values less than 1 indicate a survival advantage for S-1-based chemotherapy. OS: Overall survival; HR: Hazard ratio.
Figure 2 Comparison of progression-free survival between S-1-based chemotherapy and non-S-1-based chemotherapy.
Values less than 1 indicate a survival advantage for S-1 based chemotherapy. PFS: Progression-free survival; HR: Hazard ratio.
Figure 3 Comparison of time-to-treatment failure between S-1-based chemotherapy and non-S-1-based chemotherapy.
Values less than 1 indicate a survival advantage for S-1-based chemotherapy. TTF: Time-to-treatment failure; HR: Hazard ratio.
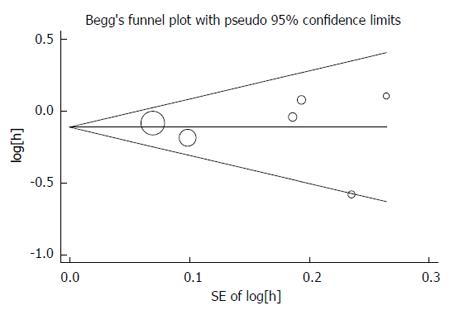
Figure 4 Begg’s funnel plot of publication bias.
-
Citation: Yang J, Zhou Y, Min K, Yao Q, Xu CN. S-1-based
vs non-S-1-based chemotherapy in advanced gastric cancer: A meta-analysis. World J Gastroenterol 2014; 20(33): 11886-11893 - URL: https://www.wjgnet.com/1007-9327/full/v20/i33/11886.htm
- DOI: https://dx.doi.org/10.3748/wjg.v20.i33.11886


