Copyright
©2014 Baishideng Publishing Group Inc.
World J Gastroenterol. Jul 7, 2014; 20(25): 8244-8252
Published online Jul 7, 2014. doi: 10.3748/wjg.v20.i25.8244
Published online Jul 7, 2014. doi: 10.3748/wjg.v20.i25.8244
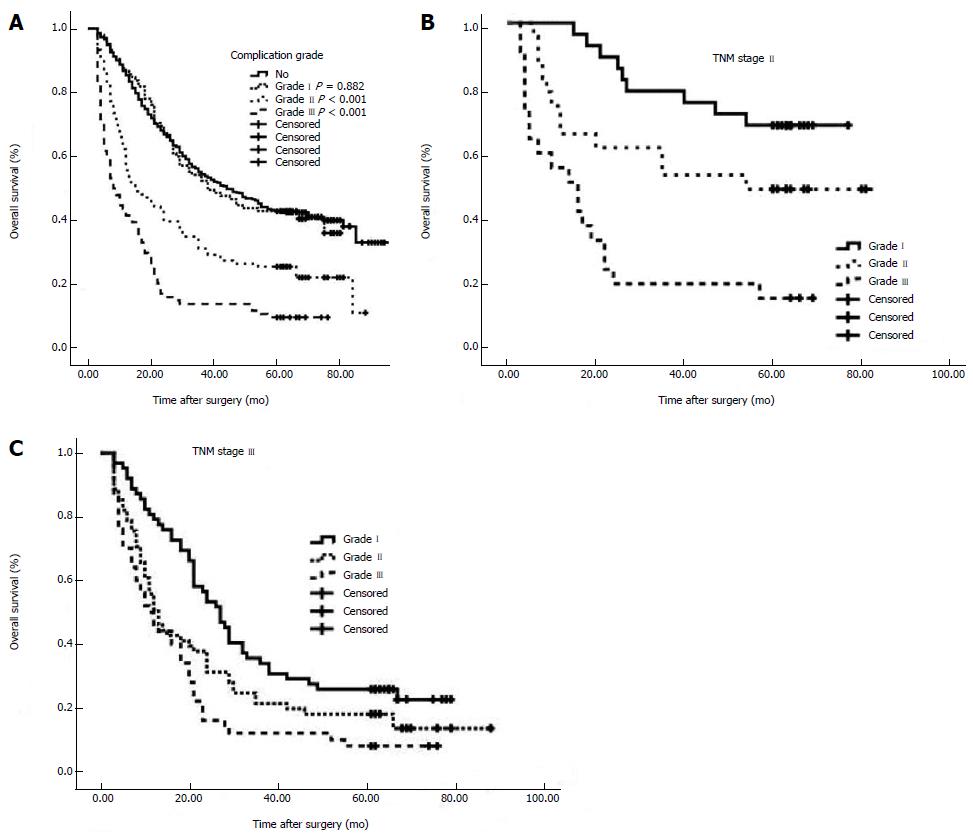
Figure 1 Overall survival curves.
A: Overall survival (OS) curves for all patients grouped by complication grade. The 5-year OS rates were 43.0%, 42.5%, 25.5% and 9.6% for no complications, and Grade I, Grade II and Grade III complications, respectively. There was no difference between Grade I complications and no complications (P = 0.882); B: OS curves for patients with TNM Stage II cancer. There were significant differences in OS among the three grades of complications in patients with tumor-node-metastasis (TNM) Stage II cancer (P < 0.001); C: OS curves for patients with TNM Stage III cancer. There were significant differences in OS among the three grades of complications in patients with TNM Stage III cancer (P = 0.001).
- Citation: Jiang N, Deng JY, Ding XW, Zhang L, Liu HG, Liang YX, Liang H. Effect of complication grade on survival following curative gastrectomy for carcinoma. World J Gastroenterol 2014; 20(25): 8244-8252
- URL: https://www.wjgnet.com/1007-9327/full/v20/i25/8244.htm
- DOI: https://dx.doi.org/10.3748/wjg.v20.i25.8244


