Copyright
©2014 Baishideng Publishing Group Inc.
World J Gastroenterol. Jul 7, 2014; 20(25): 8130-8138
Published online Jul 7, 2014. doi: 10.3748/wjg.v20.i25.8130
Published online Jul 7, 2014. doi: 10.3748/wjg.v20.i25.8130
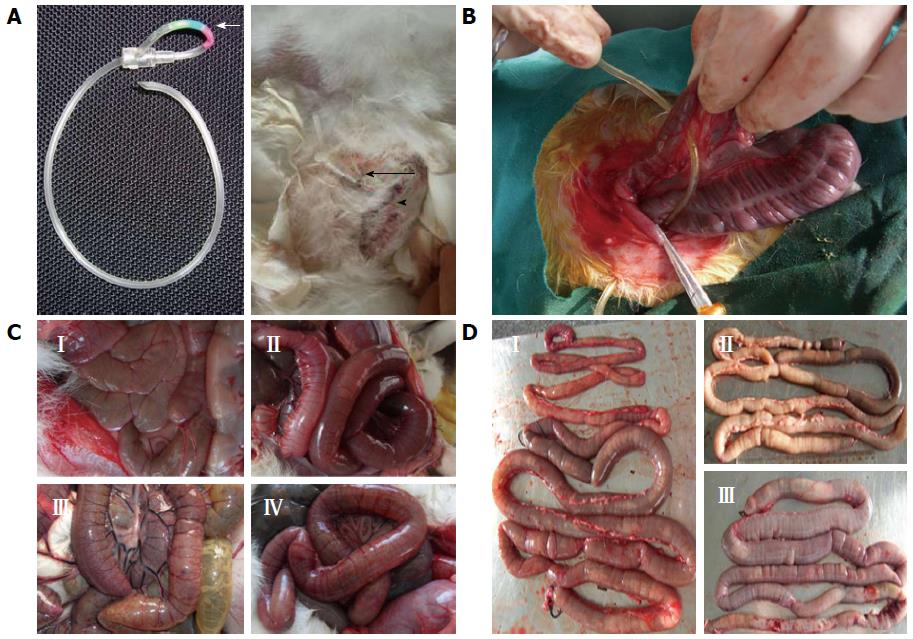
Figure 1 Establishment of a modified and controllable rabbit model of intestinal obstruction.
A: The infusion set used in this study (left), the color labels indicating the status of the lock, (right) the cut after saturation; B: Assembling the in vivo pulled-type locking clamp; C: Effect of obstruction for (I) sham-operated control and at (II) 24 h, (III) 48 h, and (IV) 72 h after obstruction; D: Gross morphology of intestinal obstruction at (I) 24 h, (II) 48 h, and (III) 72 h after obstruction.
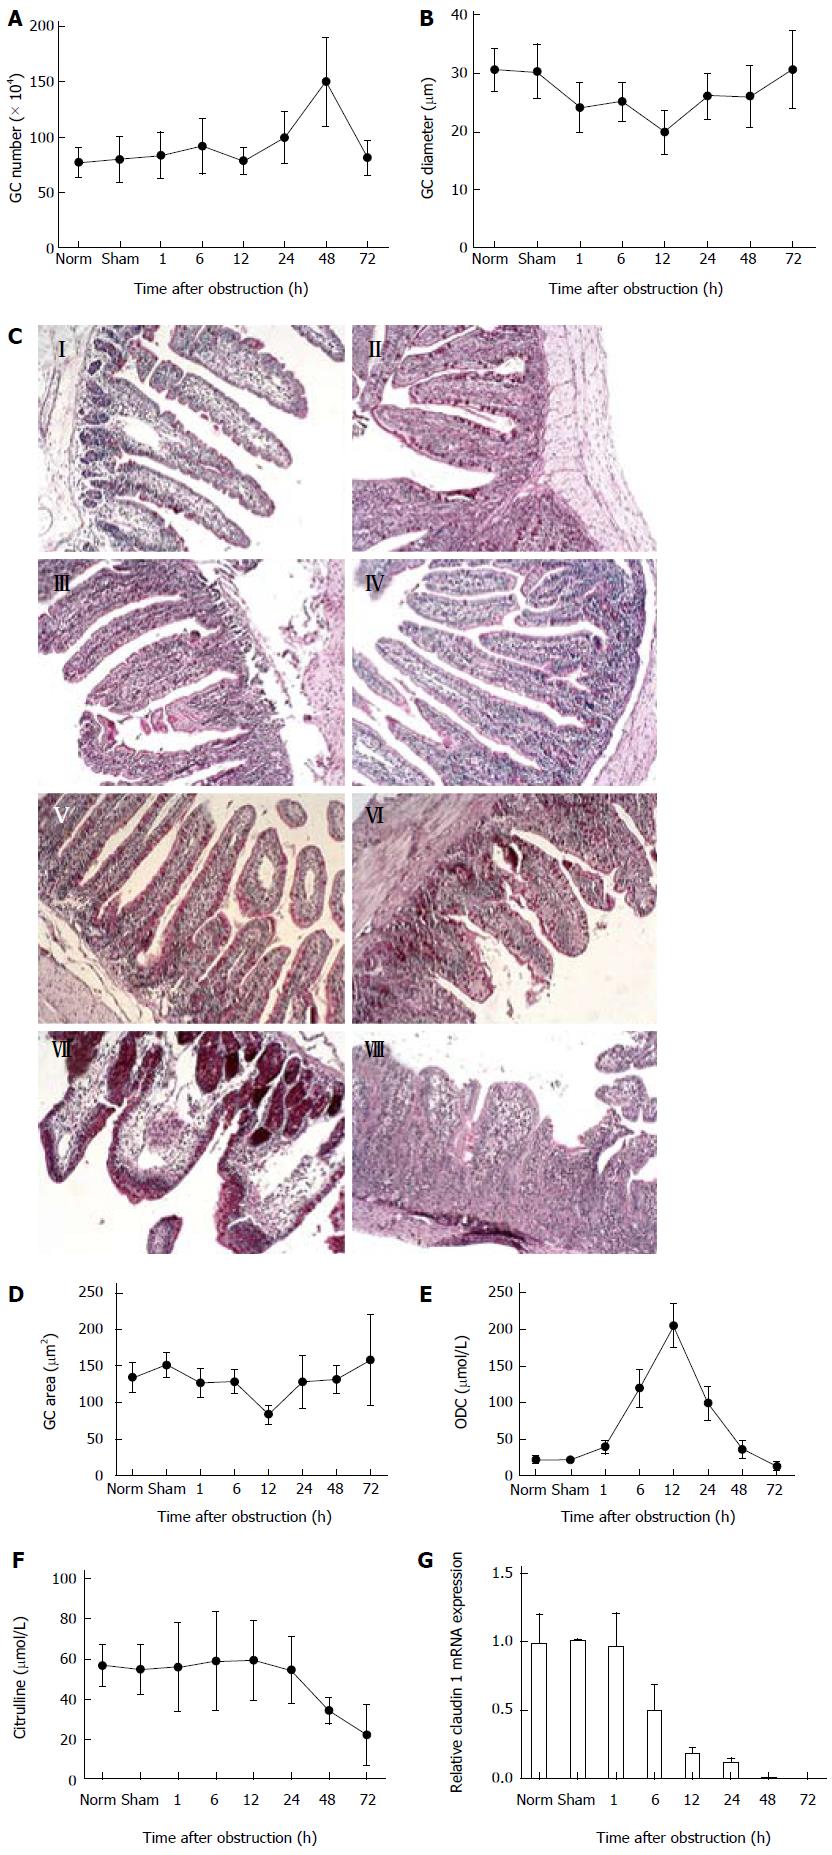
Figure 2 Intestinal obstruction alters intestinal epithelial cells.
A: Number; B: Diameter; and D: Area of goblet cells (GCs) in obstructed ileum; C: Periodic acid-Schiff-stained intestinal tissue sections from (I) non-operated controls, (II) sham-operated controls and at (III) 1 h, (IV) 6 h, (V) 12 h, (VI) 24 h, (VII) 48 h and (VIII) 72 h after obstruction; E: Ornithine decarboxylase (ODC) activity in intestinal tissues; F: Level of citrulline in serum; G: Claudin 1 gene expression.
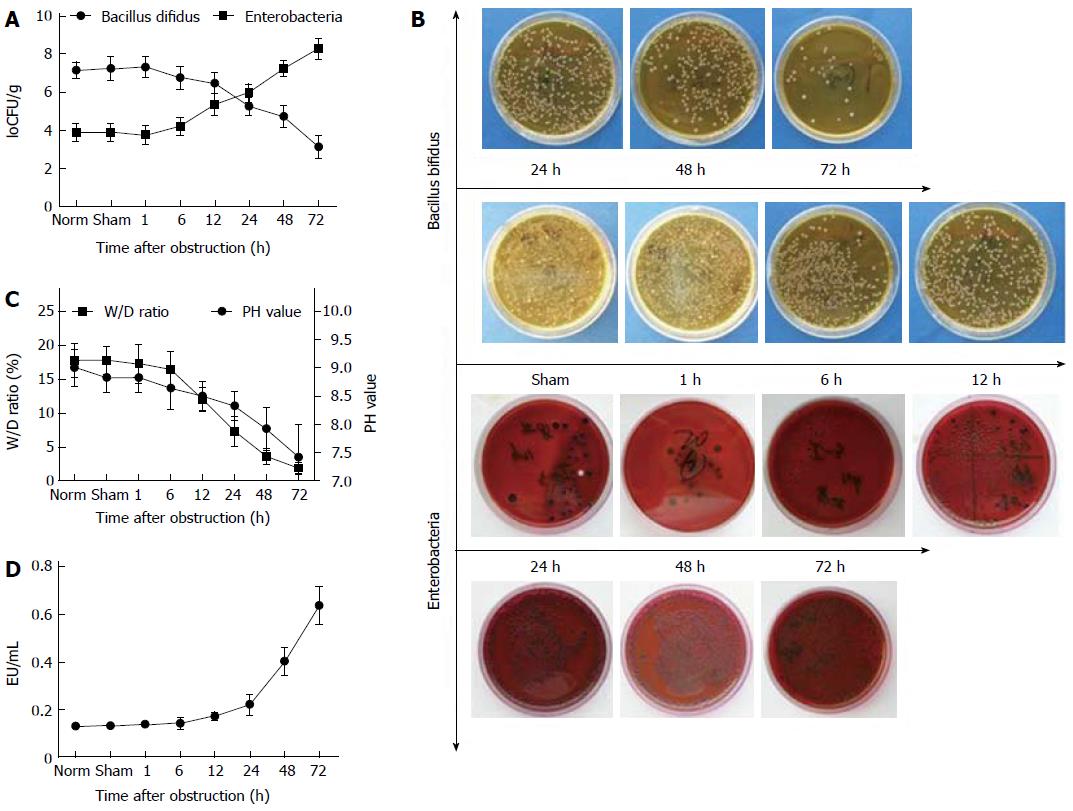
Figure 3 Intestinal obstruction disrupts the balance of intestinal microorganisms.
Quantification of A: Bacillus bifidus and B: enterobacteria in the intestinal lumen; C: Wet/dry weight ratio for intestinal contents and pH value of intestinal lumen; D: Serum endotoxin levels.
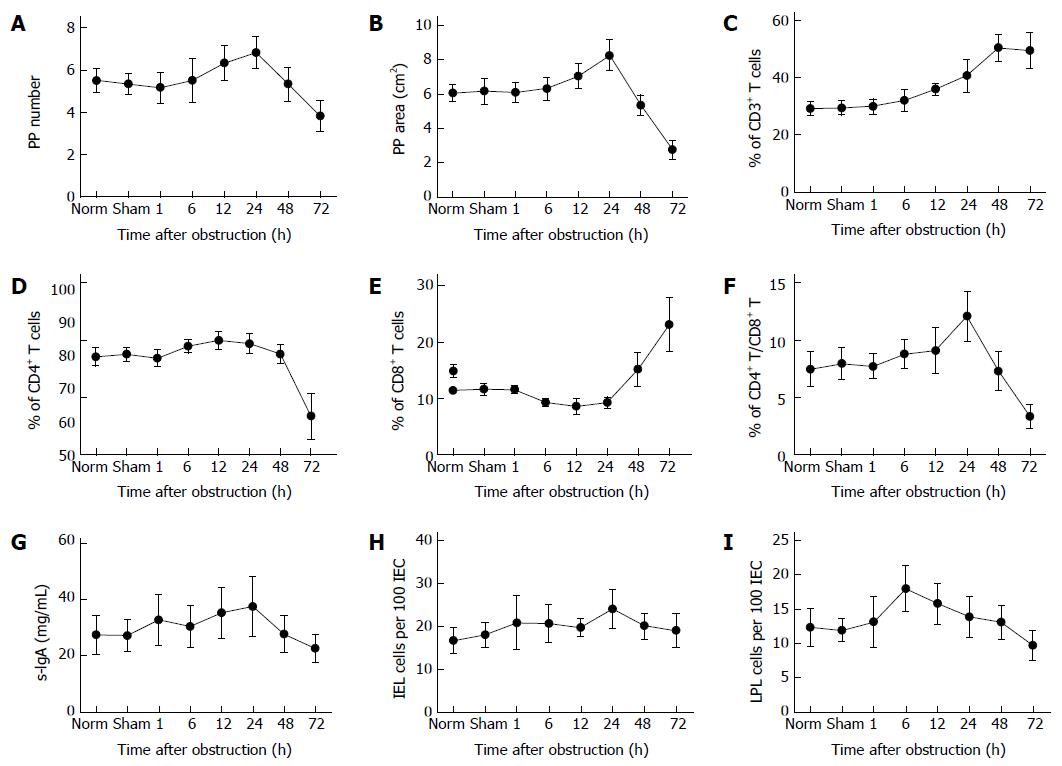
Figure 4 Intestinal obstruction disrupts the intestinal immune system.
A: The number; B: area of Peyer’s patch (PP) in obstructed ileum quantified from periodic acid–Schiff-stained tissue sections; Percentages of C: CD3+ T cells; D: CD4+ T cells; E: CD8+ T cells; F: Ratio of CD4+/CD8+ T cells; G: The level of s-IgA in intestinal lumen; H: Quantification of intraepithelial lymphocytes (IELs); I: Quantification of lamina propria lymphocytes (LPLs).
- Citation: Yu XY, Zou CL, Zhou ZL, Shan T, Li DH, Cui NQ. Phasic study of intestinal homeostasis disruption in experimental intestinal obstruction. World J Gastroenterol 2014; 20(25): 8130-8138
- URL: https://www.wjgnet.com/1007-9327/full/v20/i25/8130.htm
- DOI: https://dx.doi.org/10.3748/wjg.v20.i25.8130


