Copyright
©2014 Baishideng Publishing Group Inc.
World J Gastroenterol. Jun 28, 2014; 20(24): 7971-7978
Published online Jun 28, 2014. doi: 10.3748/wjg.v20.i24.7971
Published online Jun 28, 2014. doi: 10.3748/wjg.v20.i24.7971
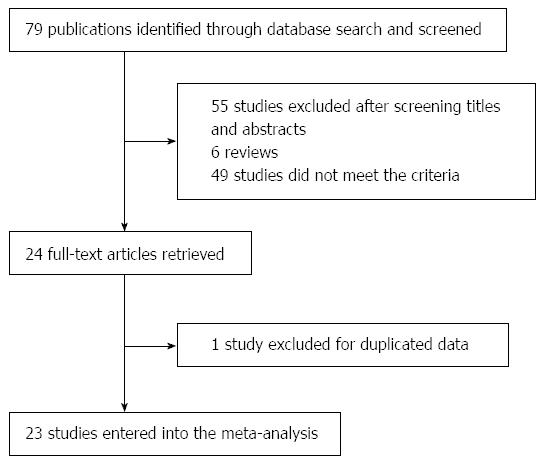
Figure 1 Flow diagram showing study methodology for measurement of regulatory T cells in hepatocellular carcinoma.
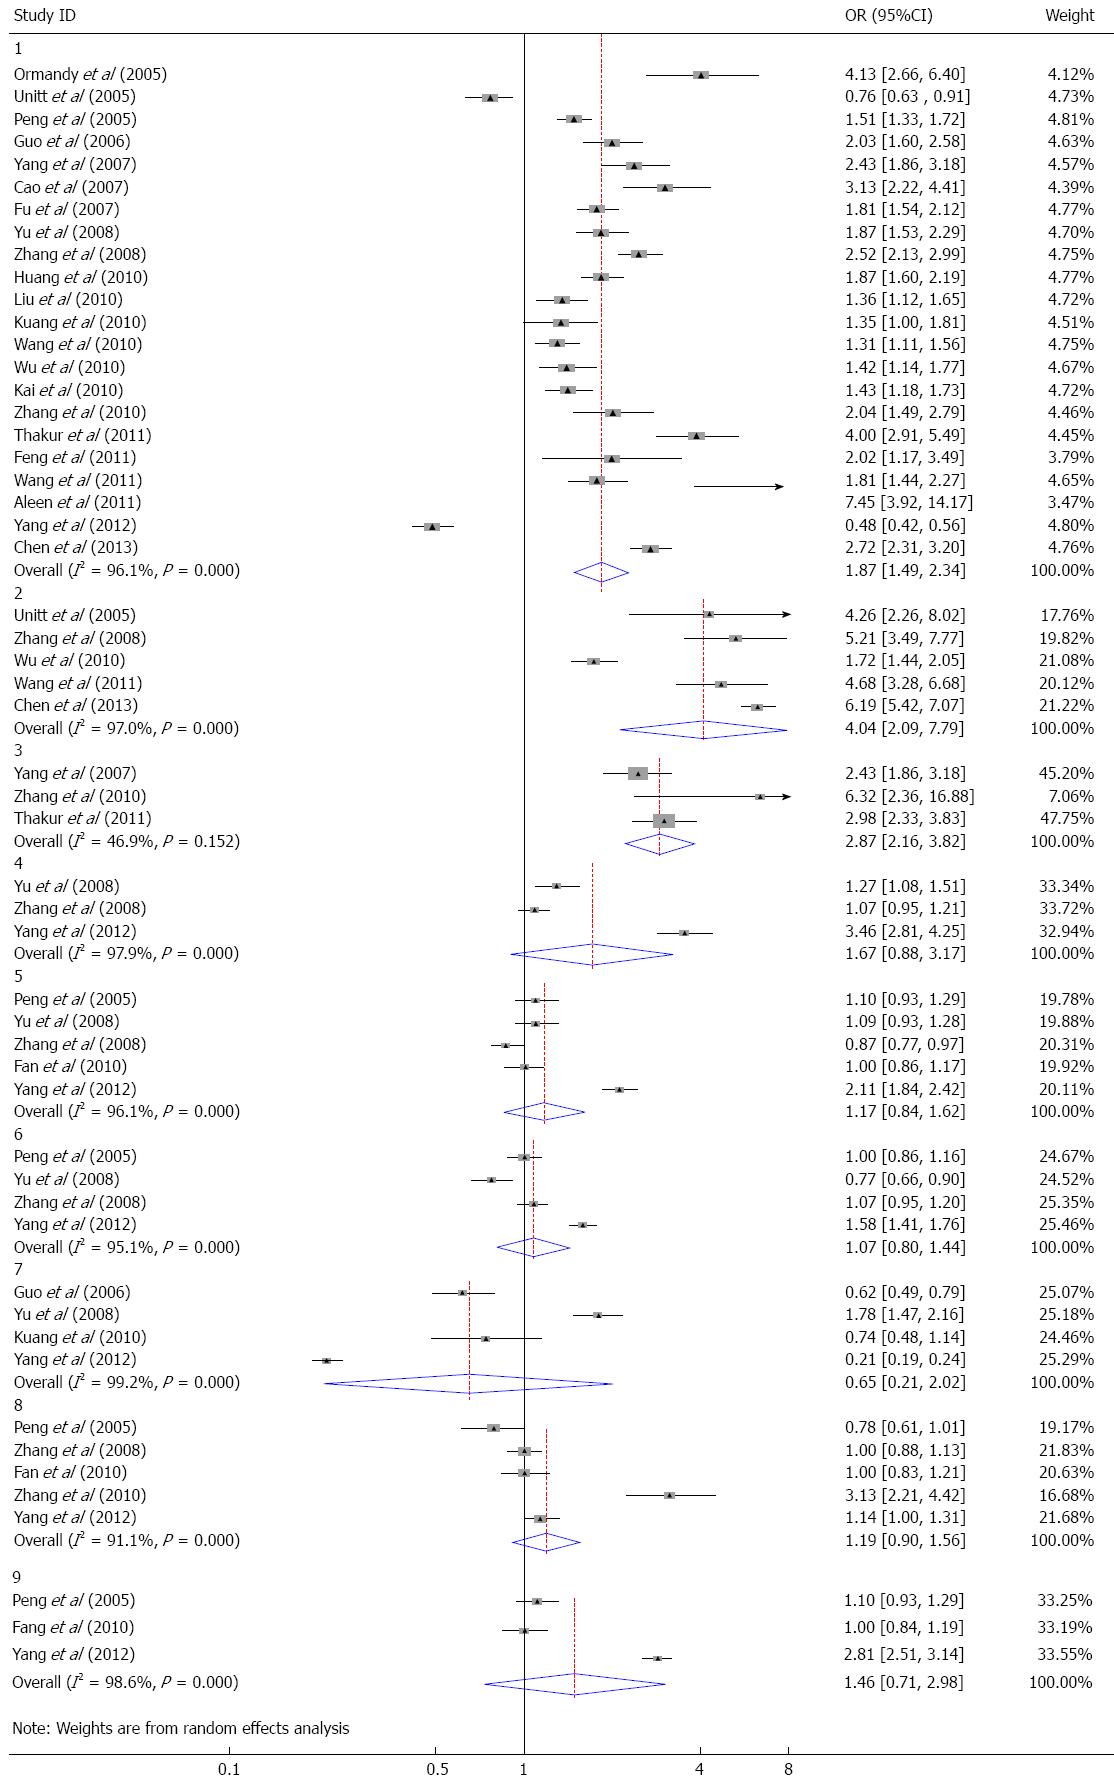
Figure 2 Integrated forest plot of pooled OR with 95%CI for this meta-analysis (corresponding to Table 2).
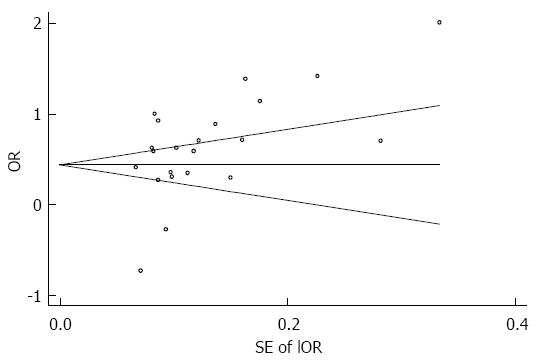
Figure 3 Funnel plot for publication bias test in the meta-analysis investing the circulating populations of Regulatory T cells between hepatocellular carcinoma patients and healthy controls.
- Citation: Zhao HQ, Li WM, Lu ZQ, Yao YM. Roles of Tregs in development of hepatocellular carcinoma: A meta-analysis. World J Gastroenterol 2014; 20(24): 7971-7978
- URL: https://www.wjgnet.com/1007-9327/full/v20/i24/7971.htm
- DOI: https://dx.doi.org/10.3748/wjg.v20.i24.7971


