Copyright
©2014 Baishideng Publishing Group Inc.
World J Gastroenterol. Jun 21, 2014; 20(23): 7505-7513
Published online Jun 21, 2014. doi: 10.3748/wjg.v20.i23.7505
Published online Jun 21, 2014. doi: 10.3748/wjg.v20.i23.7505
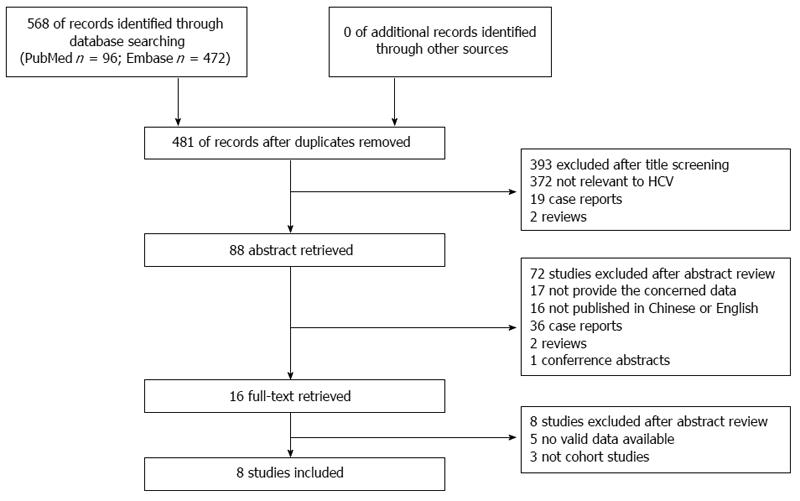
Figure 1 Flow chart illustrating the process of article selection.
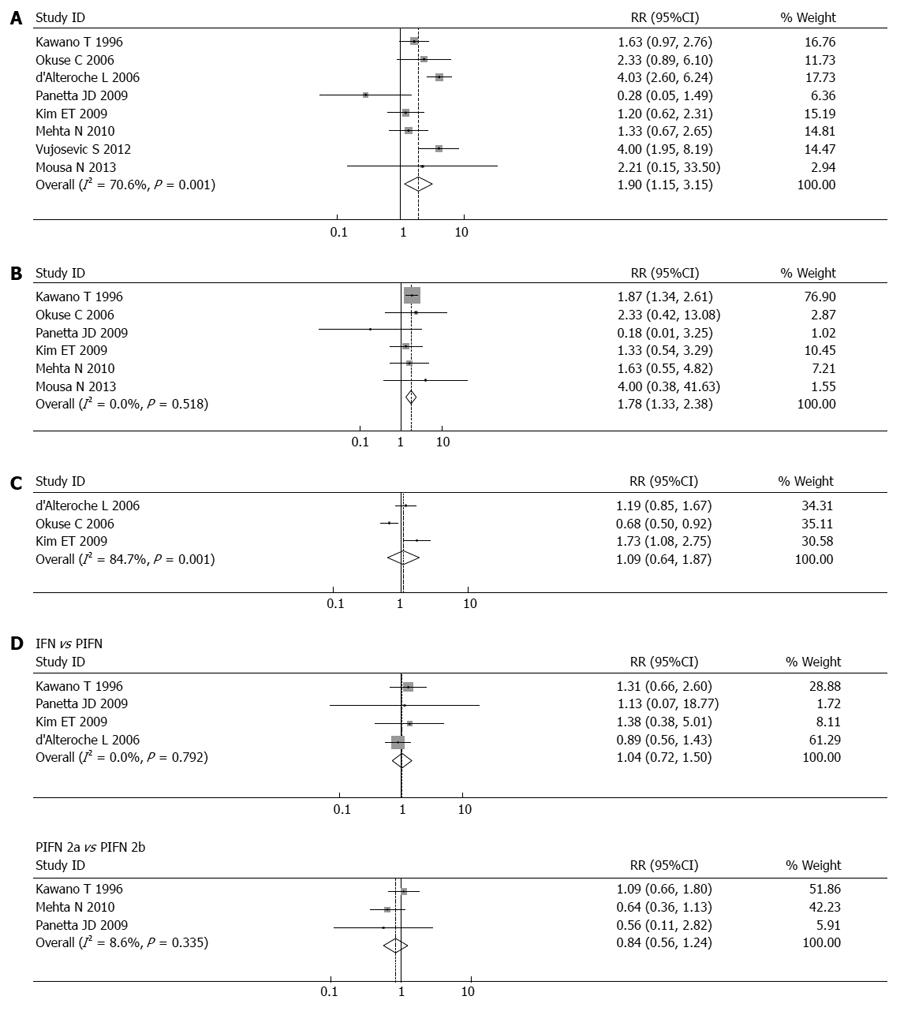
Figure 2 Forest plot.
A: RRs for the association of IAR and hypertension. Squares represent the study-specific RR. Diamonds represent the summary relative risks (SRRs). Horizontal lines represent 95%CIs. A random-effect model was used. An overall tendency toward the right side of the reference line (RR = 1) indicated that hypertension could increase the incidence of IAR; B: RRs for the association of IAR and DM. Squares represent the study-specific RR. Diamonds represent the SRRs. Horizontal lines represent 95%CIs. A random-effect model was used. An overall tendency towards the right side of the reference line (RR = 1) indicated that DM could increase the incidence of IAR; C: RRs for the association of IAR and HCV genotypes. Squares represent the study-specific RR. Diamonds represent the SRRs. Horizontal lines represent 95%CIs. A random-effect model was used. The contact of overall diamond with the reference line (RR = 1) indicated that there was no difference in IAR incidence between genotype-1-infected and genotype-2-infected patients; D: Effect of different types of IFN on IAR risk. Squares represent the study-specific RR. Diamonds represent the SRRs. Horizontal lines represent 95%CIs. A random-effect model was used. The contact of overall diamond with the reference line (RR = 1) indicated that there was no difference in IAR incidence between the PIFN α-2a group and the PIFN α-2b group or between the IFN α group and the PIFN α group.
- Citation: Xue JH, Zhu HH, Wang J, Chen Z. Interferon-associated retinopathy risk in patients with diabetes and hypertensive hepatitis C. World J Gastroenterol 2014; 20(23): 7505-7513
- URL: https://www.wjgnet.com/1007-9327/full/v20/i23/7505.htm
- DOI: https://dx.doi.org/10.3748/wjg.v20.i23.7505


