Copyright
©2014 Baishideng Publishing Group Co.
World J Gastroenterol. Apr 28, 2014; 20(16): 4723-4729
Published online Apr 28, 2014. doi: 10.3748/wjg.v20.i16.4723
Published online Apr 28, 2014. doi: 10.3748/wjg.v20.i16.4723
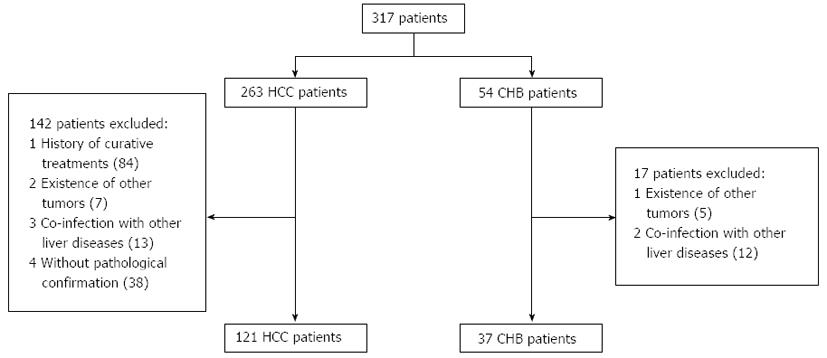
Figure 1 Patient selection process.
HCC: Hepatocellular carcinoma; CHB: Chronic hepatitis B.
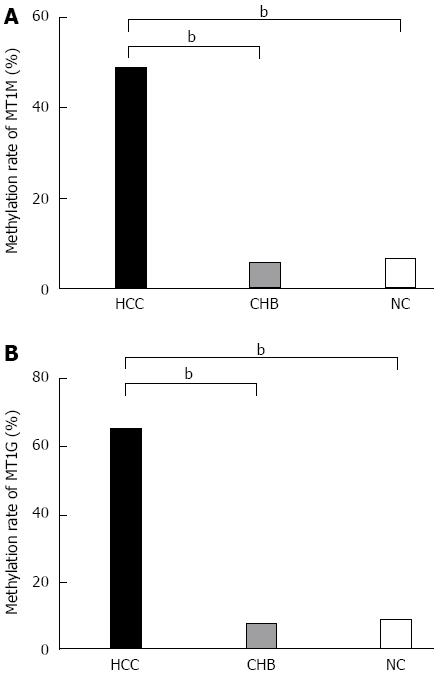
Figure 2 Percentage methylation of MT1M and MT1G in hepatocellular carcinoma, chronic hepatitis B and normal controls groups.
A: Percentage methylation of MT1M was 48.8% (59/121) in the HCC, 5.4% (2/37) in the CHB, and 6.5% (2/31) in the NC groups; B: Percentage methylation of MT1G was 70.2% (85/121) in the HCC, 16.2% (6/37) in the CHB, and 12.9% (4/31) in the NC groups (bP < 0.001).
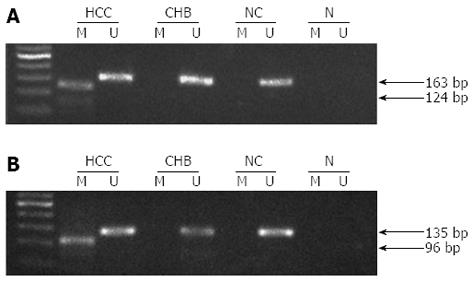
Figure 3 Representative methylation of metallothionein 1M and metallothionein 1G gene promoters by methylation-specific polymerase chain reaction.
A: The methylated and unmethylated sequences of MT1M were 124 and 163 bp, respectively; B: The methylated and unmethylated sequences of MT1G were 96 and 135 bp, respectively. N: Negative control; M: Methylation-specific primers; U: Unmethylation-specific primers.
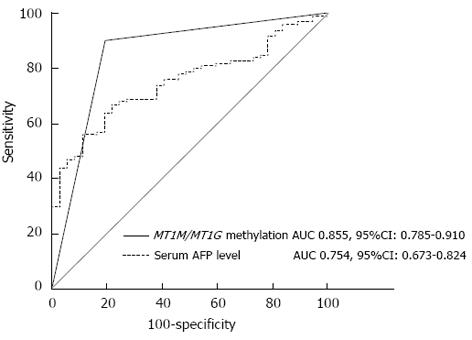
Figure 4 Receiver operating characteristic curves of α-fetoprotein and combined methylation of metallothionein 1M and metallothionein 1G promoters.
MT1M/MT1G, MT1M or MT1G promoter methylation. AUC: Area under the ROC curve; MT1M: Metallothionein 1M; MT1G: Metallothionein 1G
-
Citation: Ji XF, Fan YC, Gao S, Yang Y, Zhang JJ, Wang K.
MT1M andMT1G promoter methylation as biomarkers for hepatocellular carcinoma. World J Gastroenterol 2014; 20(16): 4723-4729 - URL: https://www.wjgnet.com/1007-9327/full/v20/i16/4723.htm
- DOI: https://dx.doi.org/10.3748/wjg.v20.i16.4723


