Copyright
©2014 Baishideng Publishing Group Co.
World J Gastroenterol. Apr 7, 2014; 20(13): 3672-3679
Published online Apr 7, 2014. doi: 10.3748/wjg.v20.i13.3672
Published online Apr 7, 2014. doi: 10.3748/wjg.v20.i13.3672
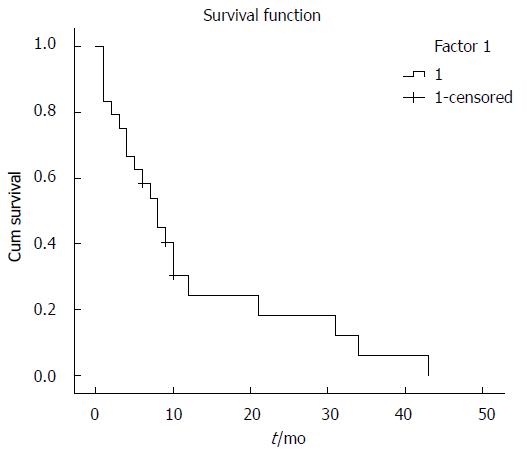
Figure 1 Survival curve of hepatic angiosarcoma patients.
A cumulative survival curve generated using the Kaplan-Meier method.
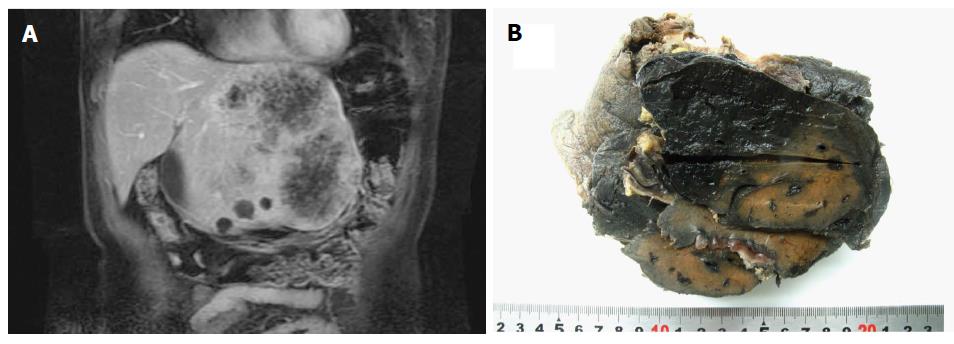
Figure 2 Magnetic resonance imaging and whole-mount images of hepatic angiosarcoma.
A: Magnetic resonance imaging of a hepatic angiosarcoma (HAS) patient showed a significantly increased volume in the left lobe of the liver and an abnormal signal shadow with heterogeneous enhancement; B: The HAS tumor showed honeycomb morphology with an ill-defined border.
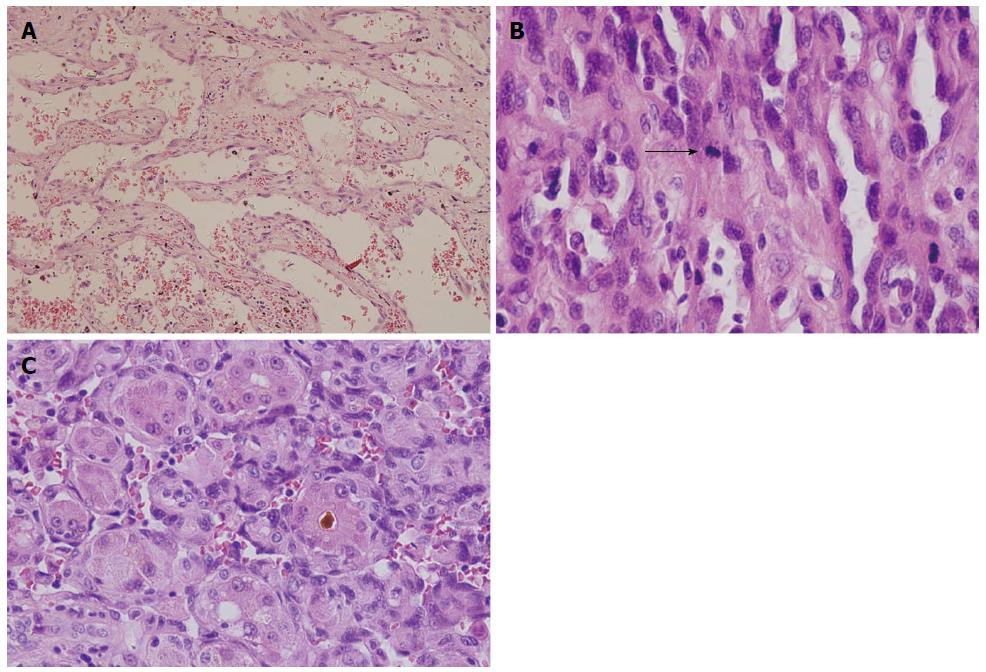
Figure 3 Analysis of hepatic angiosarcoma histology with hematoxylin and eosin staining.
A: The tumor was similar in appearance to a cavernous hemangioma on the inside and was lined by endothelial cells of similar shapes (× 200); B: Endothelial cells are distended with a spindle or polygonal morphology. Frequent mitotic events (indicated by arrow) and a pale eosinophilic cytoplasm were also observed (× 300); C: Tumor cells were observed growing around the vascular lumen and formed a vascular lumen-like structure (× 300).
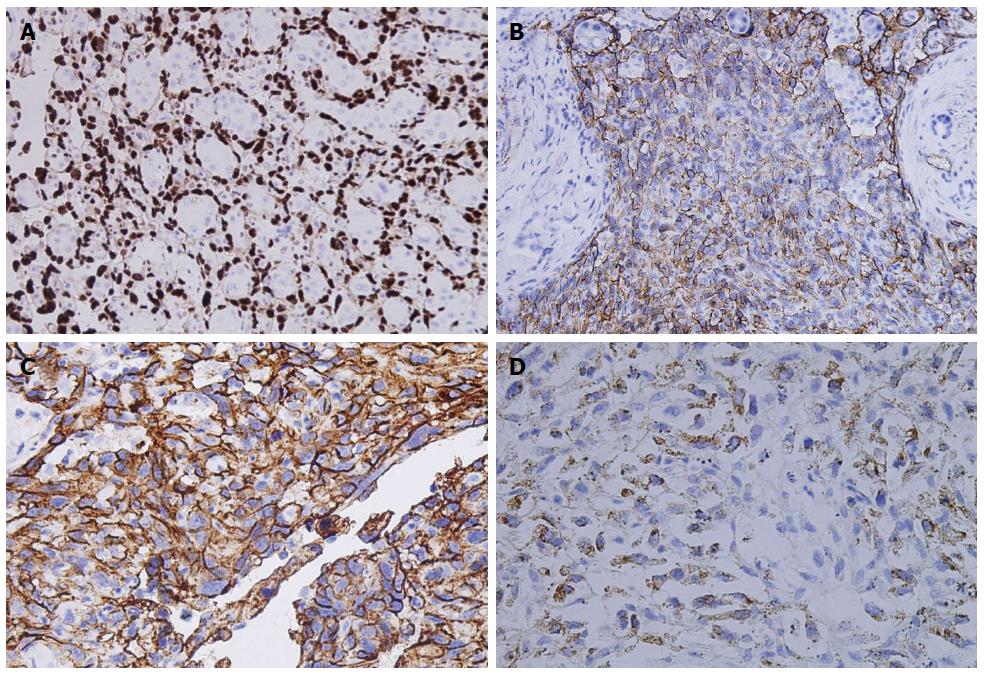
Figure 4 Expression of transcription factor ERG, CD31 (platelet/endothelial cell adhesion molecule 1), CD34 and factor VIII-related antigen in hepatic angiosarcoma tissues.
A: Positive expression was observed for nuclear ERG expression in hepatic angiosarcoma (HAS) (× 300); B: Membranous CD34 staining in HAS (× 300); C: Membranous CD31 staining in HAS; D: Cytoplasmic factor VIII-related antigen in hepatic angiosarcoma staining in HAS (× 300).
- Citation: Wang ZB, Yuan J, Chen W, Wei LX. Transcription factor ERG is a specific and sensitive diagnostic marker for hepatic angiosarcoma. World J Gastroenterol 2014; 20(13): 3672-3679
- URL: https://www.wjgnet.com/1007-9327/full/v20/i13/3672.htm
- DOI: https://dx.doi.org/10.3748/wjg.v20.i13.3672


