Copyright
©2014 Baishideng Publishing Group Co.
World J Gastroenterol. Mar 28, 2014; 20(12): 3364-3368
Published online Mar 28, 2014. doi: 10.3748/wjg.v20.i12.3364
Published online Mar 28, 2014. doi: 10.3748/wjg.v20.i12.3364
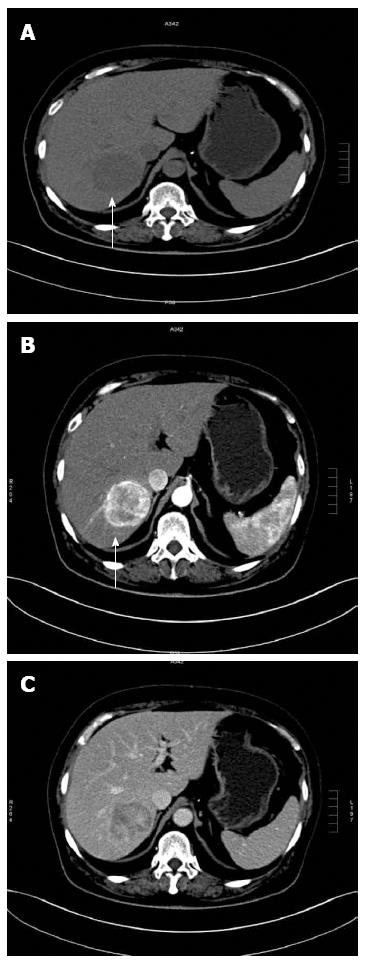
Figure 1 Computed tomography plain scanning: oval mass in posterior segment of the right hepatic lobe, slightly low density, clear boundary, and uniform density (A); venous phase: the enhancement of foci weakening (B); arterial phase: obvious and uniform enhancement of foci (C).
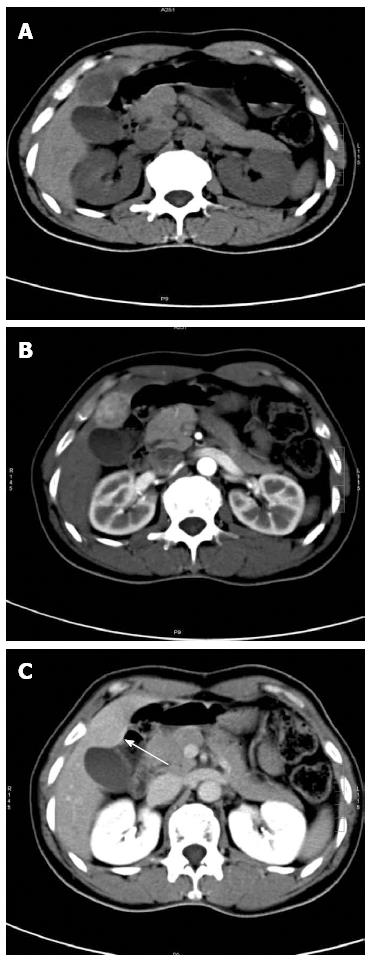
Figure 2 Arterial phase: non-uniform enhancement of foci (indicated by a white arrow), and widened vessels in central area of foci (indicated by a black arrow) (A); CT plain scanning: oval mass in the right hepatic lobe, low density, clear boundary, and uniform density (B); equilibrium phase: continuous enhancement of foci, and equidensity (C).
- Citation: Dai CL, Xue LP, Li YM. Multi-slice computed tomography manifestations of hepatic epithelioid angiomyolipoma. World J Gastroenterol 2014; 20(12): 3364-3368
- URL: https://www.wjgnet.com/1007-9327/full/v20/i12/3364.htm
- DOI: https://dx.doi.org/10.3748/wjg.v20.i12.3364


