Copyright
©2014 Baishideng Publishing Group Co.
World J Gastroenterol. Mar 28, 2014; 20(12): 3287-3300
Published online Mar 28, 2014. doi: 10.3748/wjg.v20.i12.3287
Published online Mar 28, 2014. doi: 10.3748/wjg.v20.i12.3287
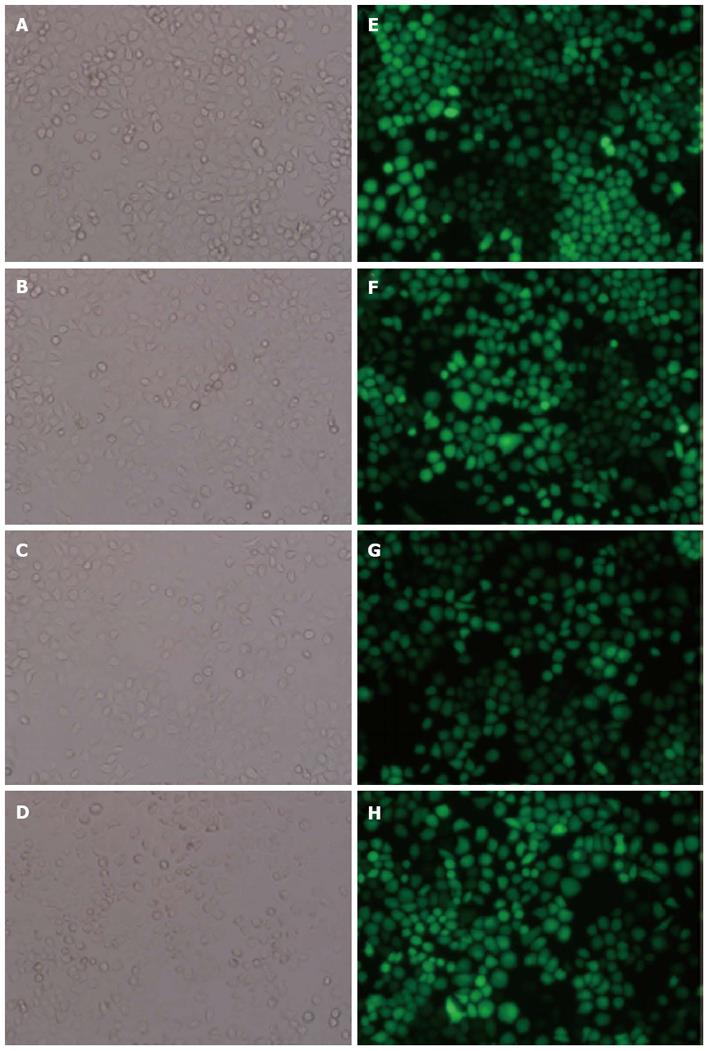
Figure 1 Establishment of the LV5-cortactin-SGC, LV5-SGC, LV3- shRNA-SGC, and LV3-SGC stable cell lines.
A, E: LV5-cortactin-SGC; B, F: LV5-SGC; C, G: LV3-shRNA-SGC; D, H: LV3-SGC. The stable transfectants expressed green fluorescent protein. The left half of the figure was obtained under light field, and the right half was obtained under fluorescence. There is no morphological difference found between the stable cell lines.
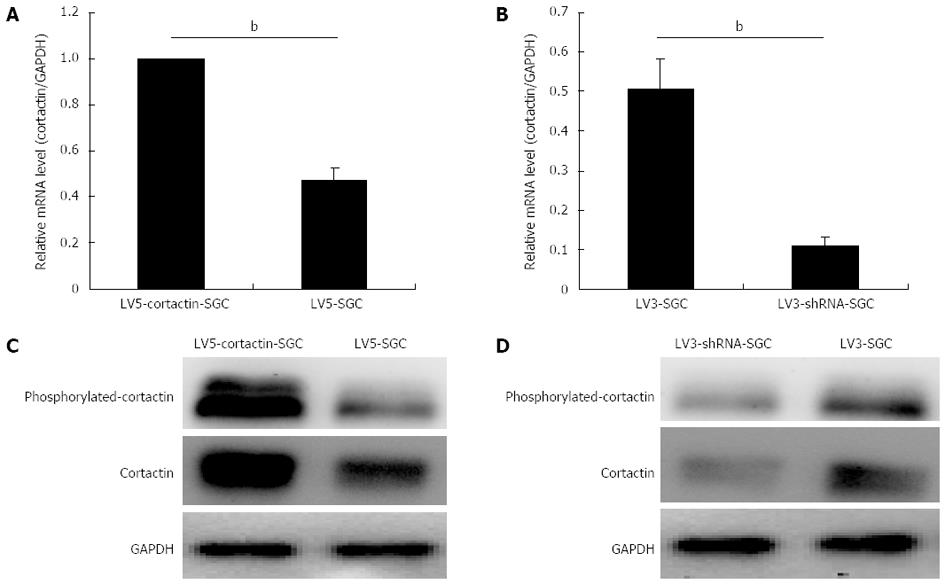
Figure 2 Cortactin expression at the mRNA and protein level in the recombinant cell lines.
A, B: Bar chart represents quantitative real-time polymerase chain reaction assessment of the cortactin mRNA levels in the LV5-cortactin-SGC, LV5-SGC, LV3-SGC and LV3-shRNA-SGC cells (bP < 0.01 between groups, Student’s t-test); C: Western blotting analysis of cortactin and phosphorylated cortactin in the LV5-cortactin-SGC and LV5-SGC control cells. The cortactin and phosphorylated cortactin increased greatly in the LV5-cortactin-SGC cells compared with the LV5-SGC cells; D: Western blotting analysis of cortactin and phosphorylated cortactin in the LV3-shRNA-SGC and LV3-SGC control cells. The levels of cortactin and phosphorylated cortactin were decreased significantly in the LV3-shRNA-SGC cells compared with LV3-SGC cells. Glyceraldehyde-3-phosphate dehydrogenase (GAPDH) was used as an internal control.
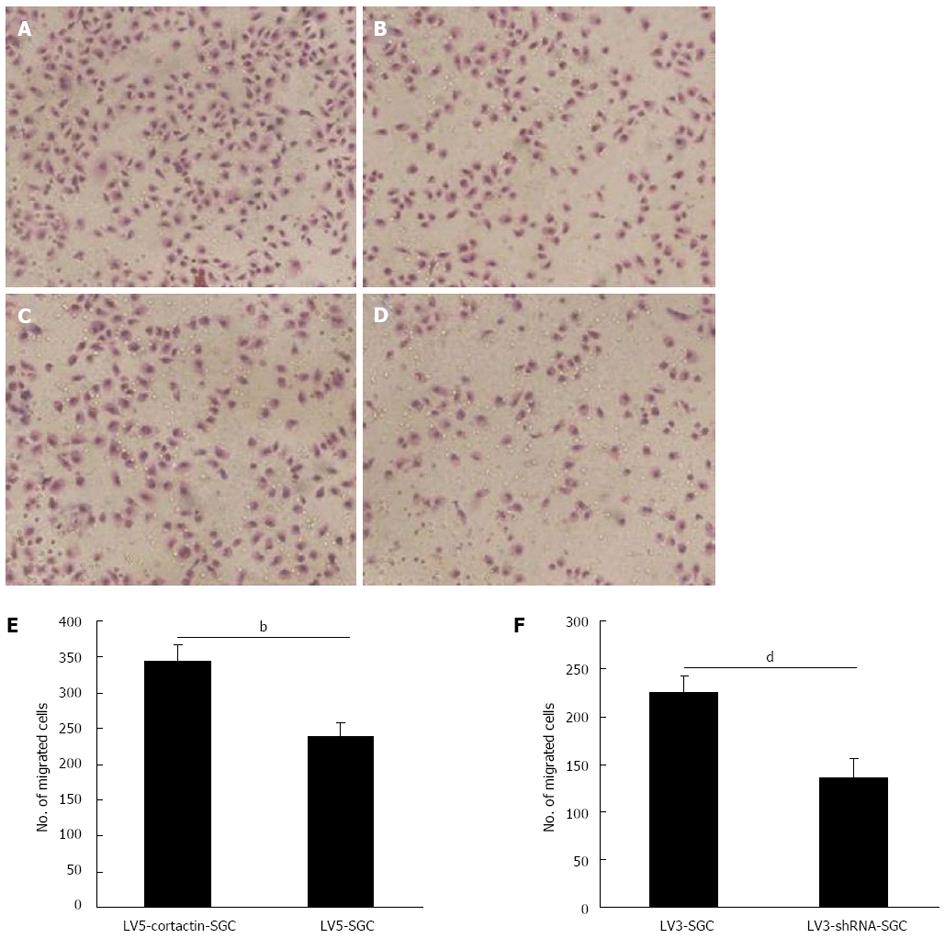
Figure 3 Cortactin expression promotes SGC-7901 cell migration.
A-D: Number of LV5-cortactin-SGC cells (A) that migrated through the chamber was greatly increased compared with that for the LV5-SGC cells (B). The number of LV3-shRNA-SGC cells (D) that migrated through the chamber was greatly decreased compared with the number of migrating LV3-SGC cells (C); E: Statistical analysis of invasion by LV5-cortactin-SGC and control LV5-SGC cells (340.7 ± 12.6 vs 229.1 ± 23.2, bP < 0.01); F: Statistical analysis of invasion by LV3-shRNA-SGC and control LV3-SGC cells (136.2 ± 19.8 vs 225 ± 17, dP < 0.01). Student’s t-test was used, and P < 0.05 was considered statistically significant.
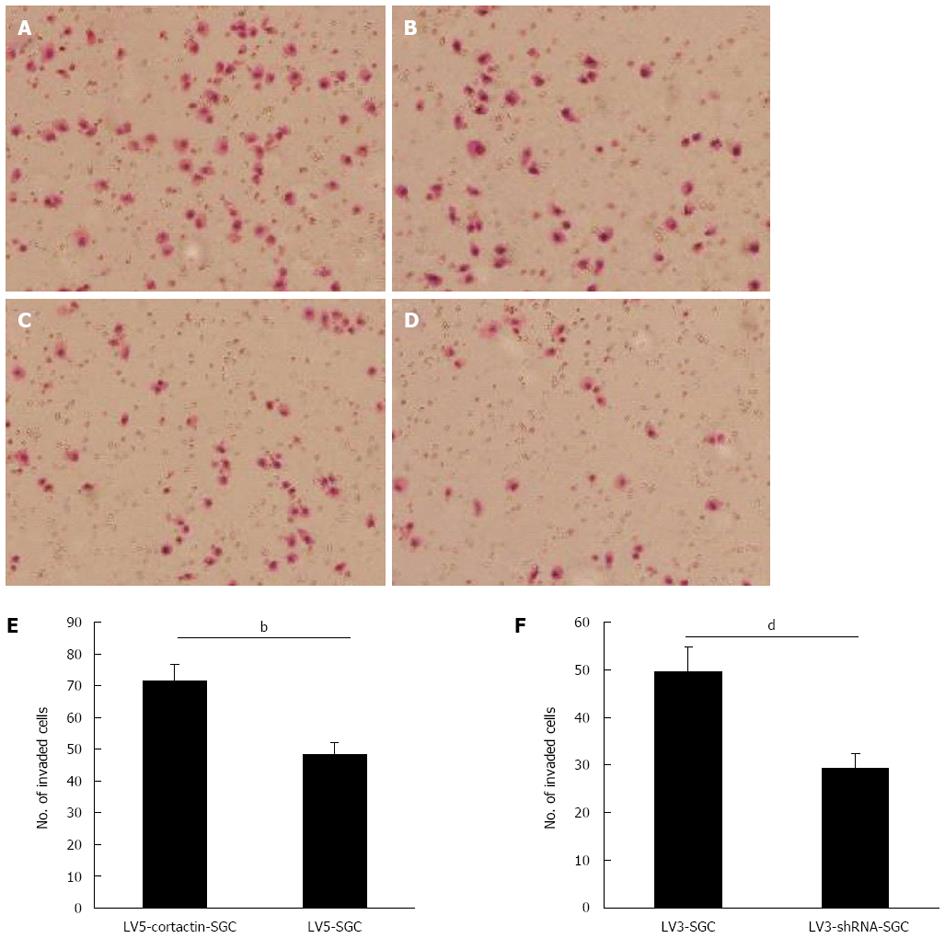
Figure 4 Cortactin expression promotes SGC-7901 cell invasions.
A-D: Number of LV5-cortactin-SGC cells (A) that invaded the chamber was greatly increased compared with the number of invading LV5-SGC cells (B). The number of LV3-shRNA-SGC cells (D) that invaded the chamber was greatly decreased compared with the number of invading LV3-SGC cells (C); E: Statistical analysis of invasion by LV5-cortactin-SGC and control LV5-SGC cells (71.6 ± 5.2 vs 48.4 ± 3.6, bP < 0.01); F: Statistical analysis of invasion by LV3-shRNA-SGC and control LV3-SGC cells (49.6 ± 3.8 vs 29.2 ± 5.2, dP < 0.01). Student’s t-test was used, and P < 0.05 was considered statistically significant.
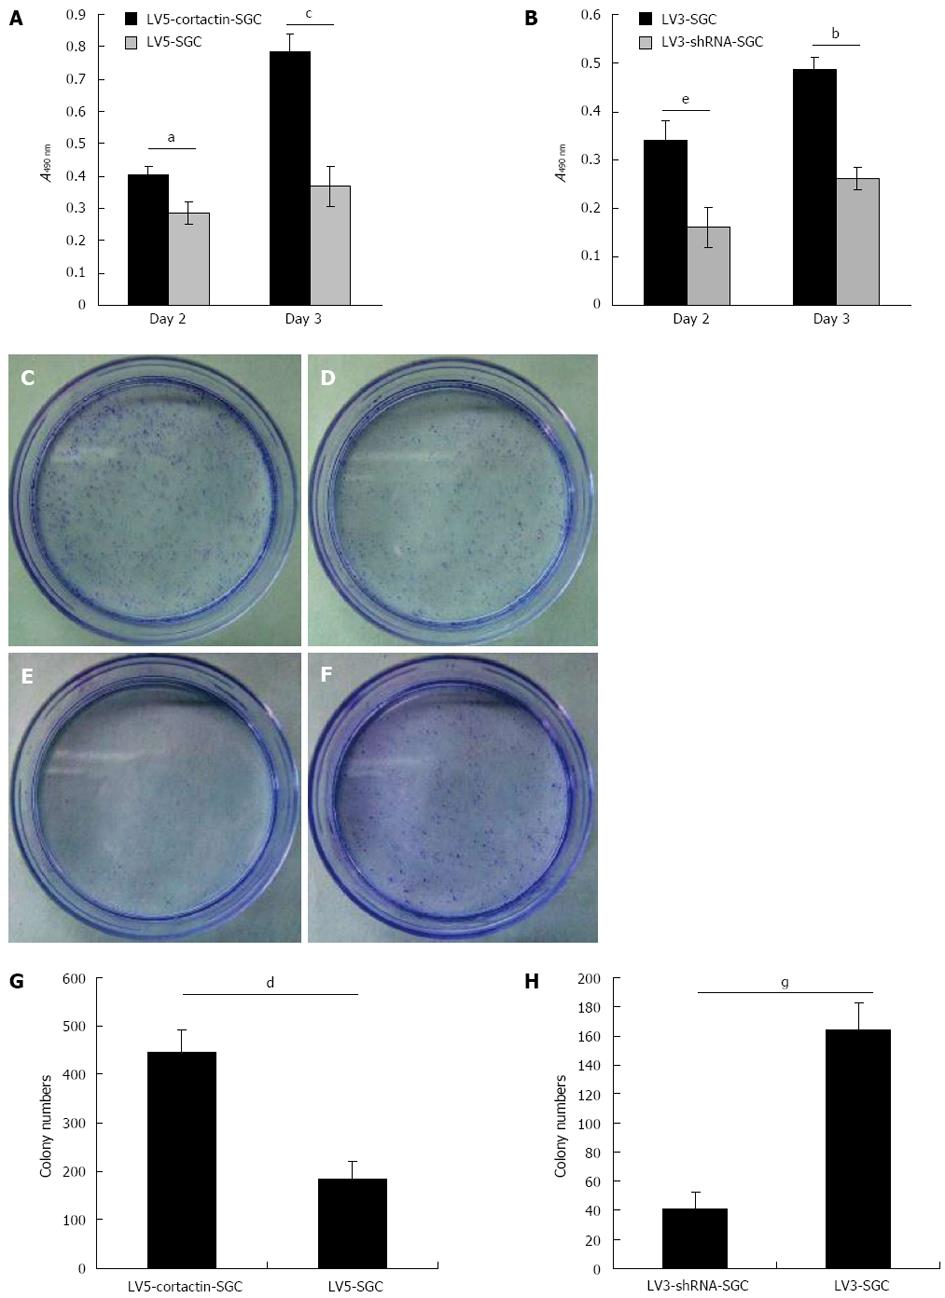
Figure 5 Cortactin expression promotes SGC-7901 cell proliferation.
A: MTT assay results showed that the LV5-cortactin-SGC cell proliferation was increased on the second (aP < 0.05 vs LV5-SGC cells) and the third (cP < 0.05 vs LV5-SGC cells) days after plating; B: LV3-shRNA-SGC cell proliferation was significantly lower on the second (eP < 0.05 vs LV3-SGC cells) and third (bP < 0.01 vs LV3-SGC cells) days after plating. The colony formation assay confirmed the role of cortactin in SGC-7901 cell proliferation. The LV5-cortactin-SGC, LV5-SGC, LV3-shRNA-SGC and LV3-SGC cell colonies were stained with crystal violet (C-F, respectively); G: The number of LV5-cortactin-SGC cell colonies was greater than LV3-SGC cell colonies (dP < 0.01 vs the number of LV5-SGC cell colonies); H: The number of LV3-shRNA-SGC cell colonies was significantly less than of LV3-SGC cell colonies (gP < 0.05 vs the number of LV5-SGC cell colonies). Student’s t-test was used, and P < 0.05 was considered significantly significant.
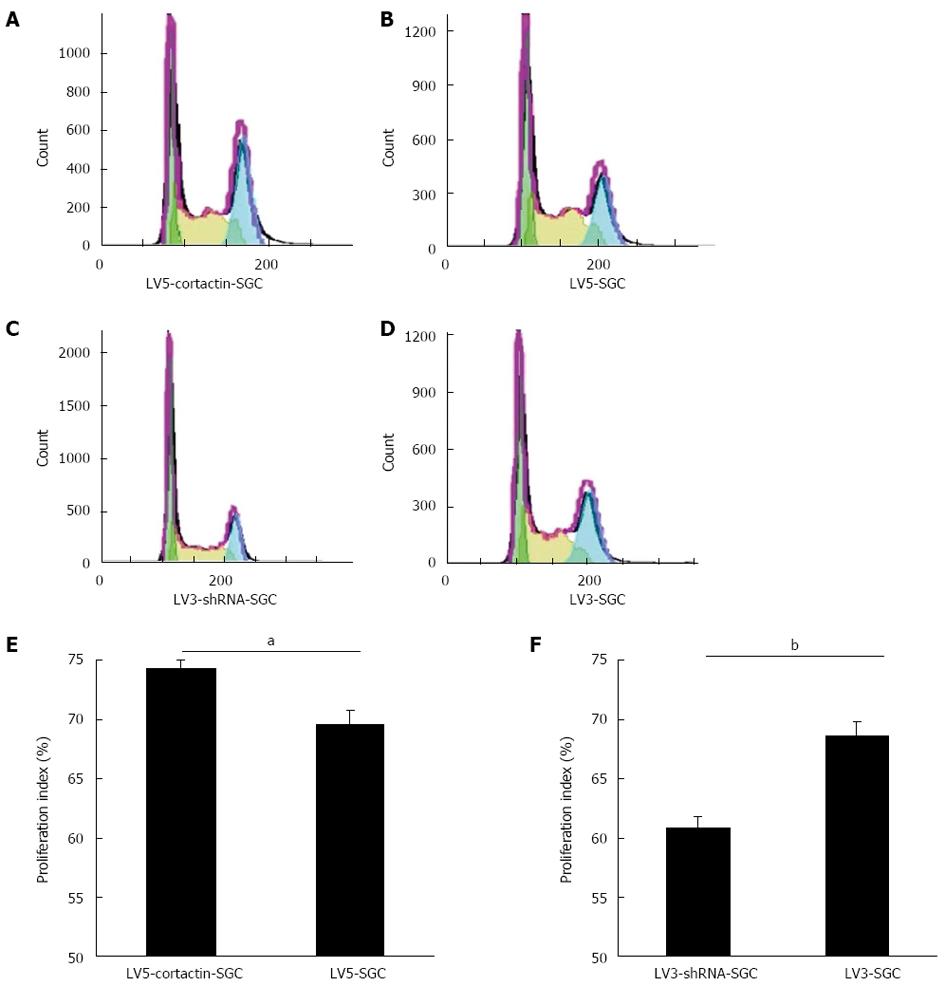
Figure 6 Effect of cortactin on the cell cycle as analyzed by flow cytometry.
A-D: Cell-cycle stages of LV5-cortactin-SGC, LV5-SGC, LV3-shRNA-SGC and LV3-SGC cells were detected by flow cytometry; E: Proliferation indexes of LV5-cortactin-SGC and LV5-SGC cells, aP < 0.05 between groups was assessed by Student’s t-test; F: Proliferation indexes of LV3-shRNA-SGC and LV3-SGC cells, bP < 0.01 between groups was assessed by Student’s t-test. P < 0.05 was considered to be significantly significant.
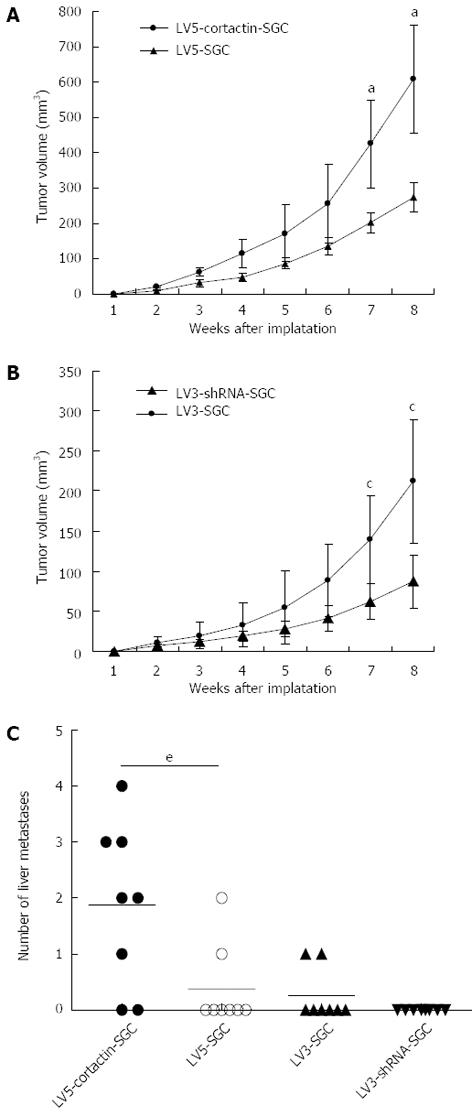
Figure 7 Cortactin expression promotes SGC-7901 cell growth and metastasis in vivo.
A: Growth curves of the primary tumor volumes (mm3) of the LV5-cortactin-SGC and LV5-SGC cells (aP < 0.05 vs LV5-SGC cells, Student’s t-test); B: Growth curves of primary tumor volumes (mm3) of the LV3-shRNA-SGC and LV3-SGC cells (cP < 0.05 vs LV5-SGC cells, Student’s t-test); C: Number of liver metastases in the four cell lines (eP < 0.05 vs LV5-SGC cells, Mann Whitney U test).
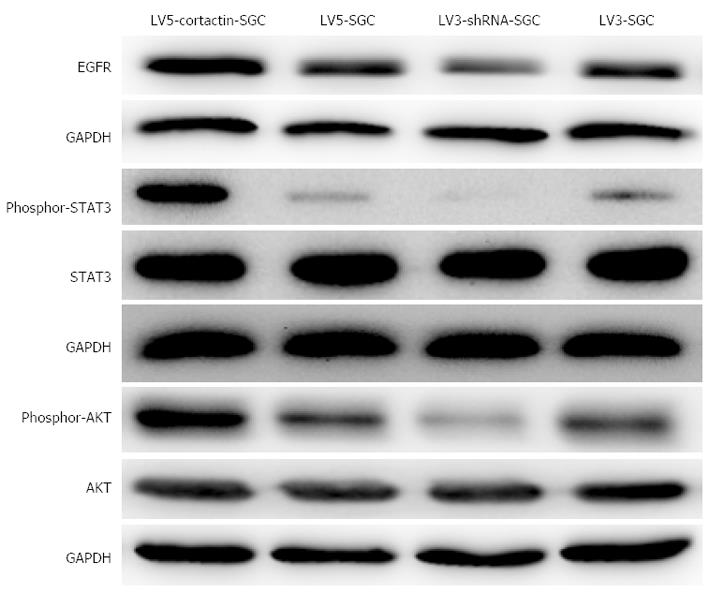
Figure 8 Cortactin expression promotes epidermal growth factor receptor expression and activates the downstream molecules AKT and signal transducer and activator of transcription 3.
Western blotting results show that epidermal growth factor receptor (EGFR), phosphor-signal transducer and activator of transcription 3 (STAT3) and phosphor-AKT were increased in LV5-cortactin-SGC cells and decreased in LV3-shRNA-SGC cells compared with their control cells. No alteration in the expression of total STAT3 and total AKT was observed in the four cell lines.
- Citation: Wei J, Zhao ZX, Li Y, Zhou ZQ, You TG. Cortactin expression confers a more malignant phenotype to gastric cancer SGC-7901 cells. World J Gastroenterol 2014; 20(12): 3287-3300
- URL: https://www.wjgnet.com/1007-9327/full/v20/i12/3287.htm
- DOI: https://dx.doi.org/10.3748/wjg.v20.i12.3287


