Copyright
©2014 Baishideng Publishing Group Co.
World J Gastroenterol. Mar 21, 2014; 20(11): 3011-3017
Published online Mar 21, 2014. doi: 10.3748/wjg.v20.i11.3011
Published online Mar 21, 2014. doi: 10.3748/wjg.v20.i11.3011
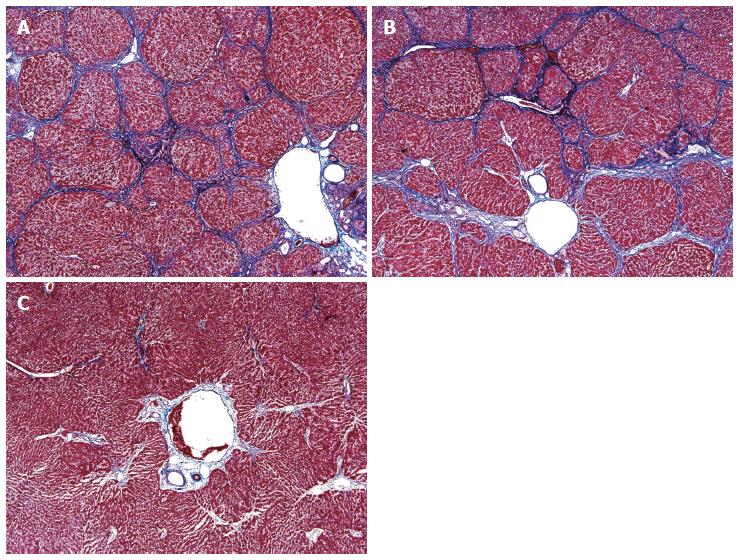
Figure 1 Histology of hepatic fibrosis and cirrhosis.
A, B: The livers obtained from 8 of 10 hypoxic rats (A) and 9 of 10 hyperoxic rats (B) demonstrated obvious histological findings of hepatic cirrhosis, including the formation of structurally abnormal parenchymal nodules and confluent fibrotic septa; C: In contrast, 6 of 10 untreated rat livers showed periportal fibrosis only (Masson trichrome stain; original magnification, × 40).
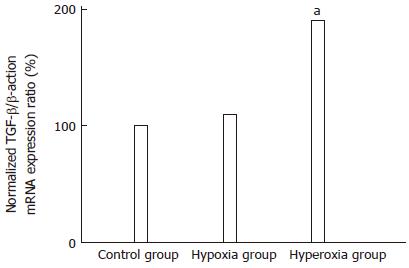
Figure 2 Quantitation of hepatic transformation growth factor-β mRNA expression level using real-time reverse-transcriptase polymerase chain reaction analysis.
Results are mean values of 2 independent experiments with 10 rats in each group. The mean value of the normalized hepatic transformation growth factor-β (TGF-β)/β-actin mRNA expression ratio in the hyperoxic rats was significantly higher than that in the untreated rats. aP < 0.05 vs the corresponding values in the control group.
- Citation: Lee SH, Do SI, Kim HS. Hyperoxia accelerates progression of hepatic fibrosis by up-regulation of transforming growth factor-β expression. World J Gastroenterol 2014; 20(11): 3011-3017
- URL: https://www.wjgnet.com/1007-9327/full/v20/i11/3011.htm
- DOI: https://dx.doi.org/10.3748/wjg.v20.i11.3011


