Copyright
©2014 Baishideng Publishing Group Co.
World J Gastroenterol. Mar 21, 2014; 20(11): 2902-2912
Published online Mar 21, 2014. doi: 10.3748/wjg.v20.i11.2902
Published online Mar 21, 2014. doi: 10.3748/wjg.v20.i11.2902
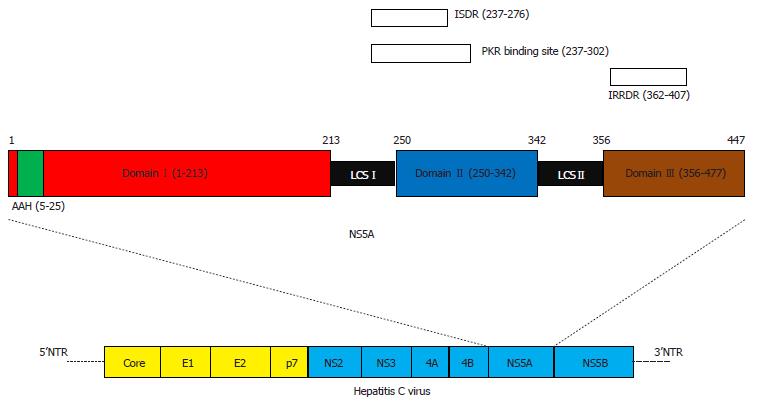
Figure 1 Structure of hepatitis C virus NS5A and hepatitis C virus (upper part and lower part, respectively)[22-35].
AAH: Amphipathic alpha helix; ISDR: Interferon sensitivity-determining region; IRRDR: Interferon/ribavirin resistance-determining region; LCS: Low-complexity sequence; NTR: Non-translated region.
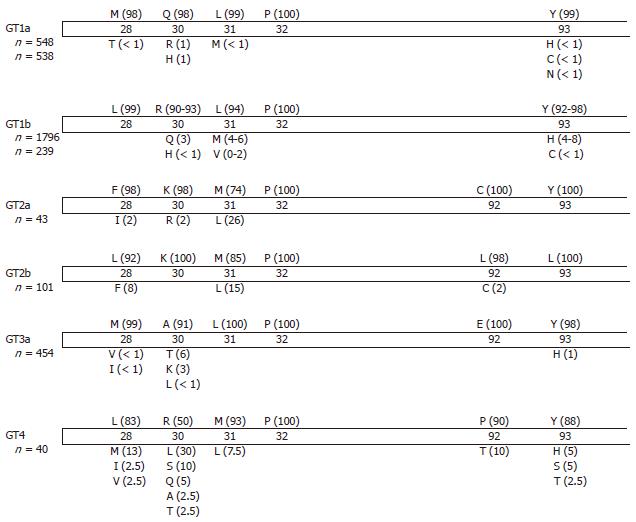
Figure 2 Prevalence of naturally occurring resistance variants against hepatitis C virus NS5A in previous reports.
Each bar represents an NS5A terminal protein with amino acid numbers. Letters within the bars represent the dominant amino acid at the indicated positions (prevalence %). Letters below the bars represent minor amino acids, and amino acids’ prevalence (%) is shown in parentheses. Genotype (GT) 1a, based on Ref[40] (n = 548) and Ref[68](n = 538); GT1b, based on Ref[40] (n = 1796) and Ref[68](n = 239); GT2, based on Los Alamos HCV data-base (n = 43 and n = 101 for GT2a and GT2b, respectively); GT3a, based on Ref[57] (n = 454); GT4, based on Ref[58] (n = 40).
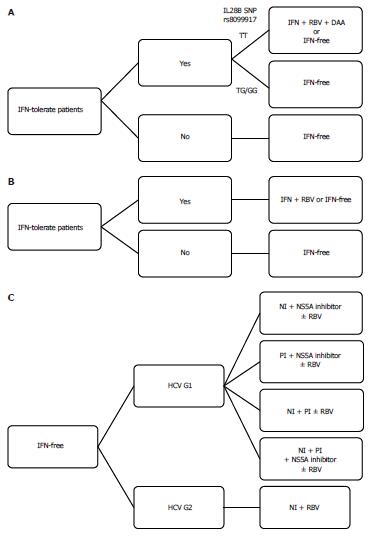
Figure 3 Algorithm of current hepatitis C virus treatment options.
A: Hepatitis C virus (HCV) genotype 1 patients; B: HCV genotype 2 patients; C: Interferon (IFN)-free regimens. G1: Genotype 1; G2: Genotype 2; RBV: Ribavirin; NI: Nucleoside inhibitor; PI: Protease inhibitor.
- Citation: Nakamoto S, Kanda T, Wu S, Shirasawa H, Yokosuka O. Hepatitis C virus NS5A inhibitors and drug resistance mutations. World J Gastroenterol 2014; 20(11): 2902-2912
- URL: https://www.wjgnet.com/1007-9327/full/v20/i11/2902.htm
- DOI: https://dx.doi.org/10.3748/wjg.v20.i11.2902


