Copyright
©2014 Baishideng Publishing Group Co.
World J Gastroenterol. Jan 7, 2014; 20(1): 274-281
Published online Jan 7, 2014. doi: 10.3748/wjg.v20.i1.274
Published online Jan 7, 2014. doi: 10.3748/wjg.v20.i1.274
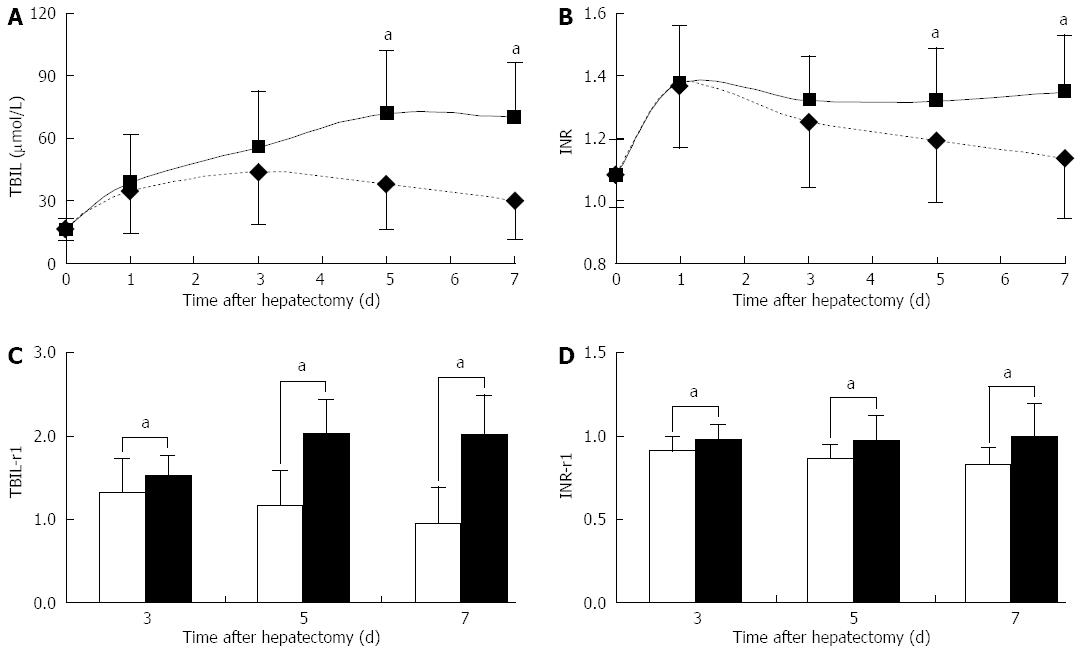
Figure 1 Dynamic changes in postoperative liver function indexes in cases of liver failure-related death and the remaining patients.
Values are expressed as mean SD, aP < 0.05 between groups. A: Total bilirubin (TBIL); B: International normalized ratio (INR); C: The ratio of total bilirubin on postoperative day (POD) X to the value on POD 1(TBIL-r1); D: The ratio of international normalized ratio on POD X to the value on POD 1 (INR-r1).
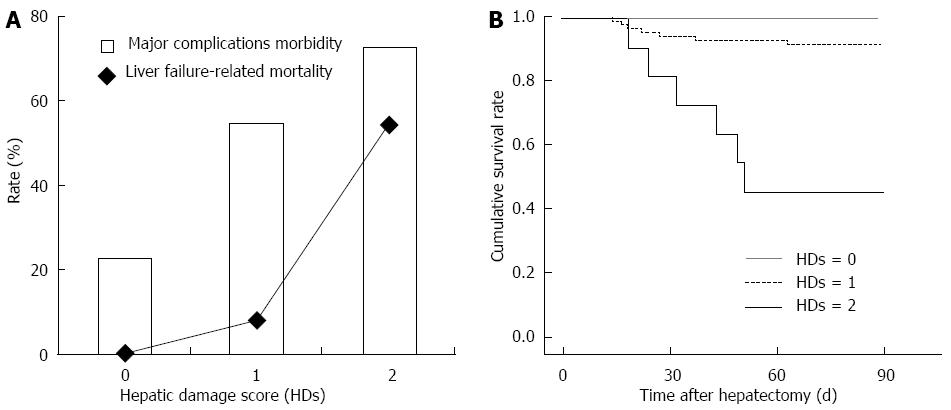
Figure 2 Liver failure-related mortality and major complication morbidity rates (A) and cumulative survival curves (B) of the three groups.
A: Any two groups had significant differences in liver failure-related mortality and major complications morbidity (P < 0.001), except the major complication morbidity between groups B and C (P = 0.414); B: Patients who died of any causes not related to liver failure were calculated as censored data.
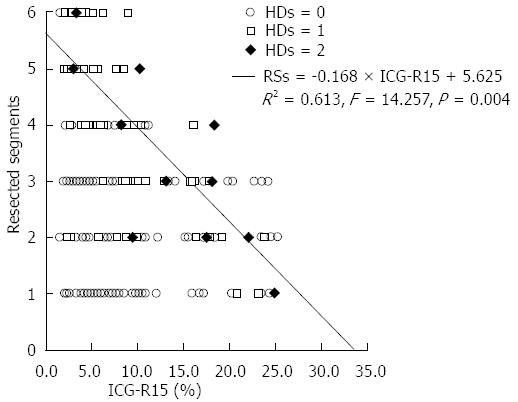
Figure 3 Relationship between the number of resected segments and pre-operative the indocyanine green retention rate at 15 min values for 478 patients.
An equation was established based on eleven patients who had a hepatic damage score of 2. HDs: Hepatic damage score; RS: Resected segment;.ICG: Indocyanine green.
- Citation: Du ZG, Wei YG, Chen KF, Li B. An accurate predictor of liver failure and death after hepatectomy: A single institution’s experience with 478 consecutive cases. World J Gastroenterol 2014; 20(1): 274-281
- URL: https://www.wjgnet.com/1007-9327/full/v20/i1/274.htm
- DOI: https://dx.doi.org/10.3748/wjg.v20.i1.274


