Copyright
©2013 Baishideng Publishing Group Co.
World J Gastroenterol. Mar 7, 2013; 19(9): 1444-1450
Published online Mar 7, 2013. doi: 10.3748/wjg.v19.i9.1444
Published online Mar 7, 2013. doi: 10.3748/wjg.v19.i9.1444
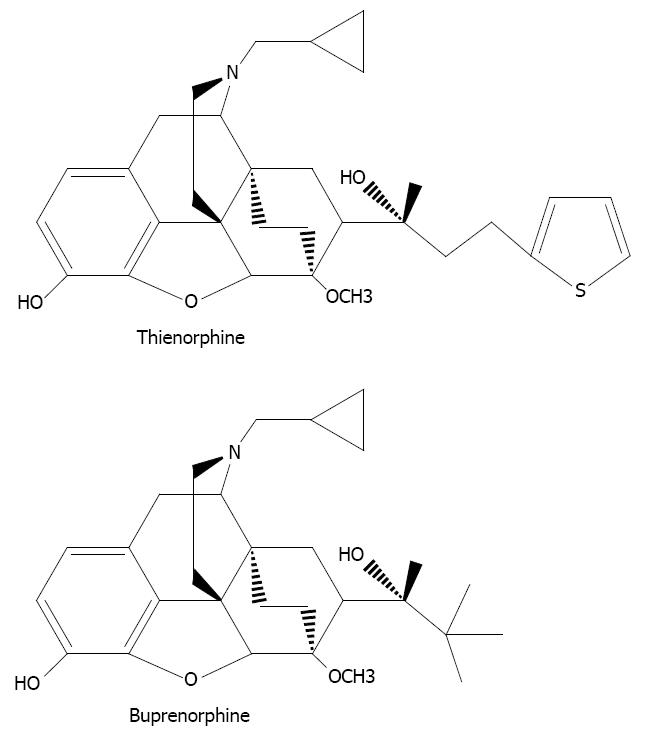
Figure 1 Chemical structure of thienorphine and buprenorphine.
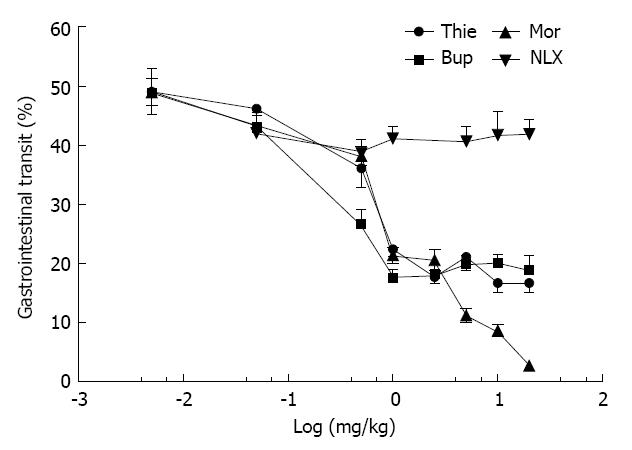
Figure 2 Effects of thienorphine, buprenorphine, morphine and naloxone on gastrointestinal propulsive activity in Kunming mice.
Gastrointestinal transit was expressed as % of the distance traveled by an orally administered marker relative to the total length of the small intestine over 15 min after marker administration. Each column and vertical bar represent the mean ± SE of 9-10 mice. Thie: Thienorphine; Bup: Buprenorphine; Mor: Morphine; NLX: Naloxone.
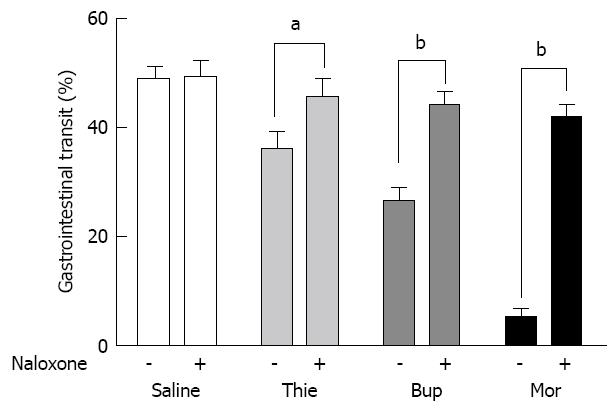
Figure 3 Effects of naloxone on the gastrointestinal propulsive activity in Kunming mice treated with thienorphine (0.
5 mg/kg), buprenorphine (0.5 mg/kg), or morphine (10 mg/kg). Gastrointestinal transit was expressed as % of the distance traveled by an orally administered marker relative to the total length of the small intestine over 15 min after marker administration. Each column and vertical bar represent the mean ± SE of 9-10 mice. aP < 0.05, bP < 0.001 vs intestinal transit without naloxone treatment. Thie: Thienorphine; Bup: Buprenorphine; Mor: Morphine.
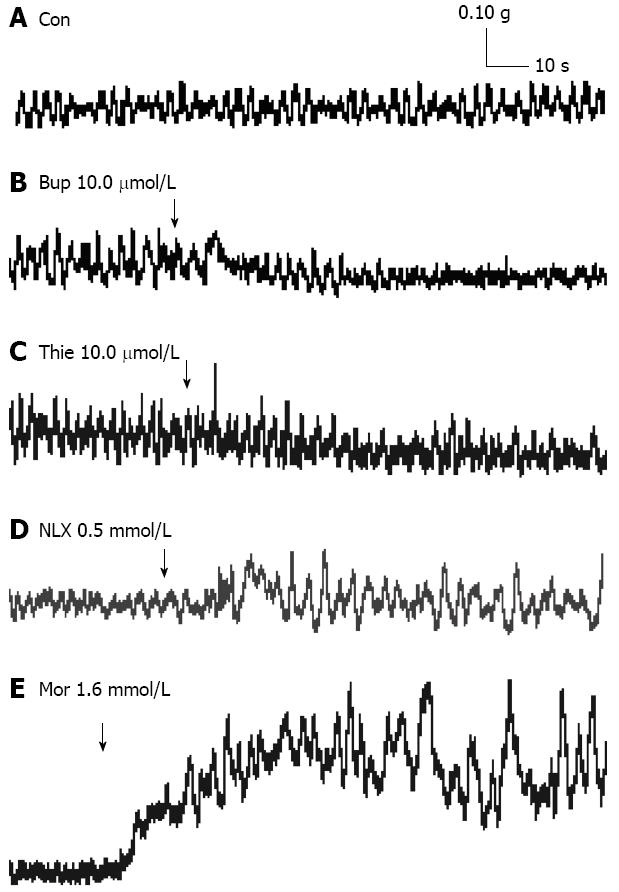
Figure 4 Typical trace of thienorphine, buprenorphine, naloxone and morphine on guinea-pig ileum.
A: Spontaneous movement of the guinea-pig ileum without chemical; B: The basal tonus decreased after buprenorphine (10.0 μmol/L) treatment; C: The basal tonus decreased after thienorphine (10.0 μmol/L) treatment; D: Spontaneous movement increased after naloxone (0.5 mmol/L) treatment; E: The basal tonus and spontaneous movement increased after morphine (1.6 mmol/L) treatment. The arrow indicates the addition of chemicals. Con: Control; Thie: Thienorphine; Bup: Buprenorphine; Mor: Morphine; NLX: Naloxone.
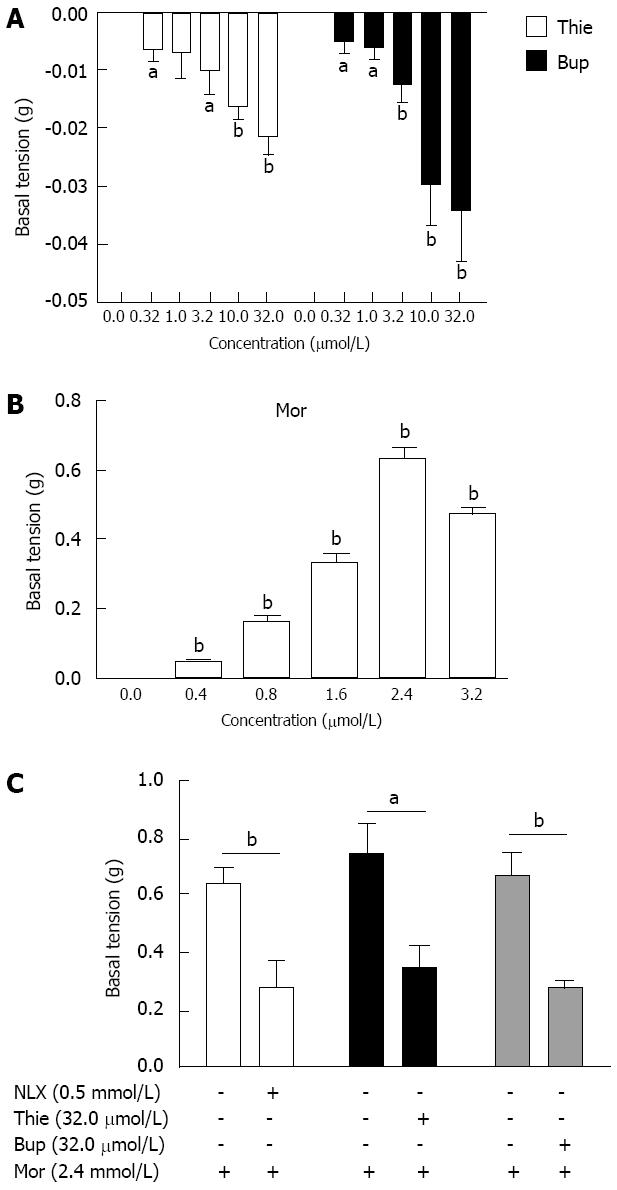
Figure 5 Effects of thienorphine, buprenorphine and morphine on the basal tonus of spontaneous movement of the guinea-pig ileum.
Each point represents the mean ± SE (n = 5 or 6 preparations). A: Thienorphine (Thie) or buprenorphine (Bup) concentration-dependently decreased the basal tonus of guinea-pig ileum (GPI); B: Morphine (Mor) concentration-dependently increased the basal tonus of GPI; C: Naloxone (NLX, 0.50 mmol/L), Thie (32.0 μmol/L) or Bup (32.0 μmol/L) antagonized the elevation of basal tonus of GPI induced by Mor (2.4 mmol/L). aP < 0.05, bP < 0.001 vs the basal tonus before chemical application.
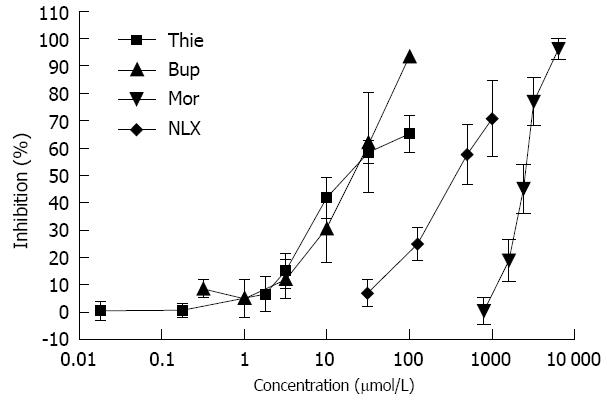
Figure 6 Effects of thienorphine, buprenorphine, morphine and naloxone on Ach-induced guinea-pig ileum contraction.
Values represent mean ± SE for 4-6 preparations. Thie: Thienorphine; Bup: Buprenorphine; Mor: Morphine; NLX: Naloxone.
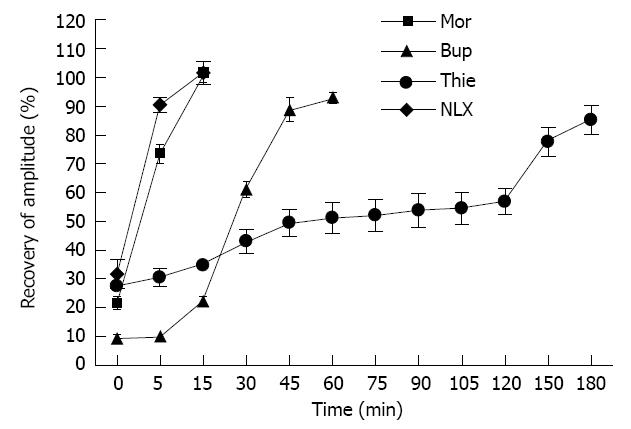
Figure 7 Time course of the amplitude inhibited by thienorphine (100 μmol/L), buprenorphine (100 μmol/L), morphine (3.
2 mmol/L) or naloxone (1.0 mmol/L) on guinea-pig ileum contraction induced by Ach (1 μmol/L) during the prolonged washing process. The data are expressed as % amplitude with respect to the amplitude before chemical application, and each point represents the mean ± SE (n = 4). Thie: Thienorphine; Bup: Buprenorphine; Mor: Morphine; NLX: Naloxone.
- Citation: Zhou PL, Li YL, Yan LD, Yong Z, Yu G, Dong HJ, Yan H, Su RB, Gong ZH. Effect of thienorphine on intestinal transit and isolated guinea-pig ileum contraction. World J Gastroenterol 2013; 19(9): 1444-1450
- URL: https://www.wjgnet.com/1007-9327/full/v19/i9/1444.htm
- DOI: https://dx.doi.org/10.3748/wjg.v19.i9.1444


