Copyright
©2013 Baishideng Publishing Group Co.
World J Gastroenterol. Feb 28, 2013; 19(8): 1278-1282
Published online Feb 28, 2013. doi: 10.3748/wjg.v19.i8.1278
Published online Feb 28, 2013. doi: 10.3748/wjg.v19.i8.1278
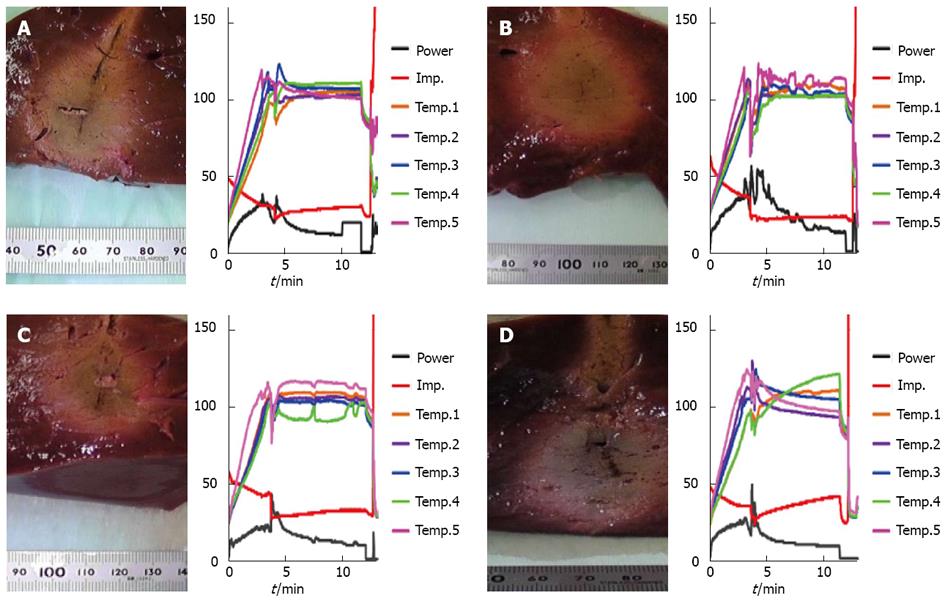
Figure 1 Transection of liver specimen with radiofrequency ablation lesion (on the left side) and graphic depiction of changes occurring in temperature (middle) with tissue impedance (red line) and power (black line) during radiofrequency ablation (on the right side) in the four groups.
A: No continuous liquid infusion; B: Saline; C: 5% glucose; D: 50% glucose.
- Citation: Ishikawa T, Kubota T, Horigome R, Kimura N, Honda H, Iwanaga A, Seki K, Honma T, Yoshida T. Radiofrequency ablation during continuous saline infusion can extend ablation margins. World J Gastroenterol 2013; 19(8): 1278-1282
- URL: https://www.wjgnet.com/1007-9327/full/v19/i8/1278.htm
- DOI: https://dx.doi.org/10.3748/wjg.v19.i8.1278


