Copyright
©2013 Baishideng Publishing Group Co.
World J Gastroenterol. Feb 21, 2013; 19(7): 1124-1134
Published online Feb 21, 2013. doi: 10.3748/wjg.v19.i7.1124
Published online Feb 21, 2013. doi: 10.3748/wjg.v19.i7.1124
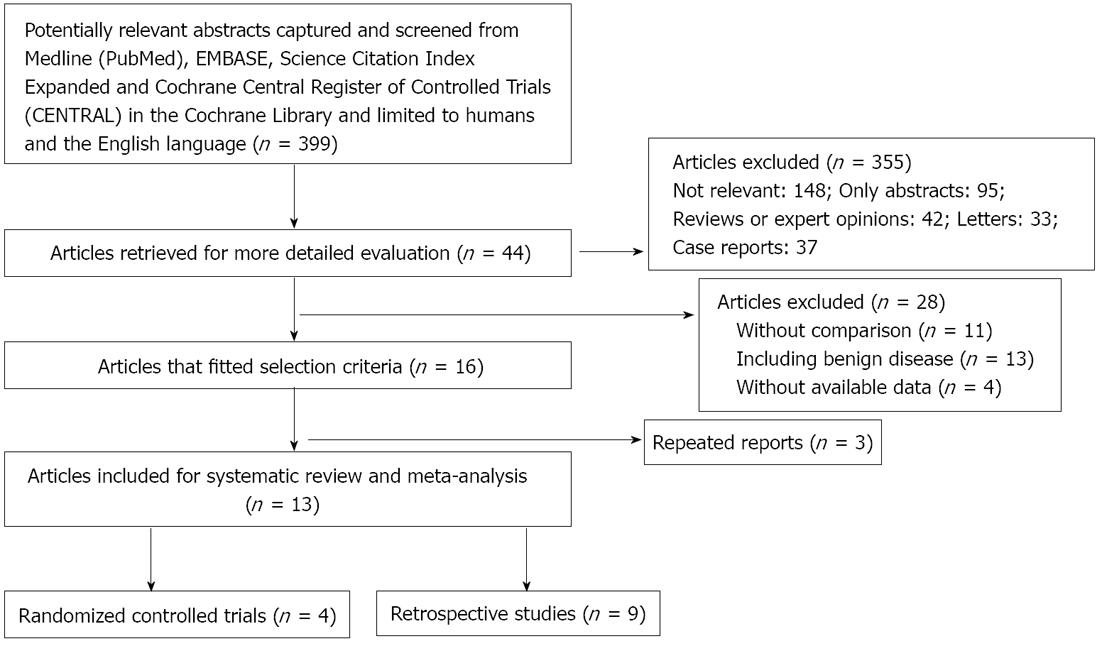
Figure 1 Flow diagram depicting the process of identification and inclusion of selected studies.
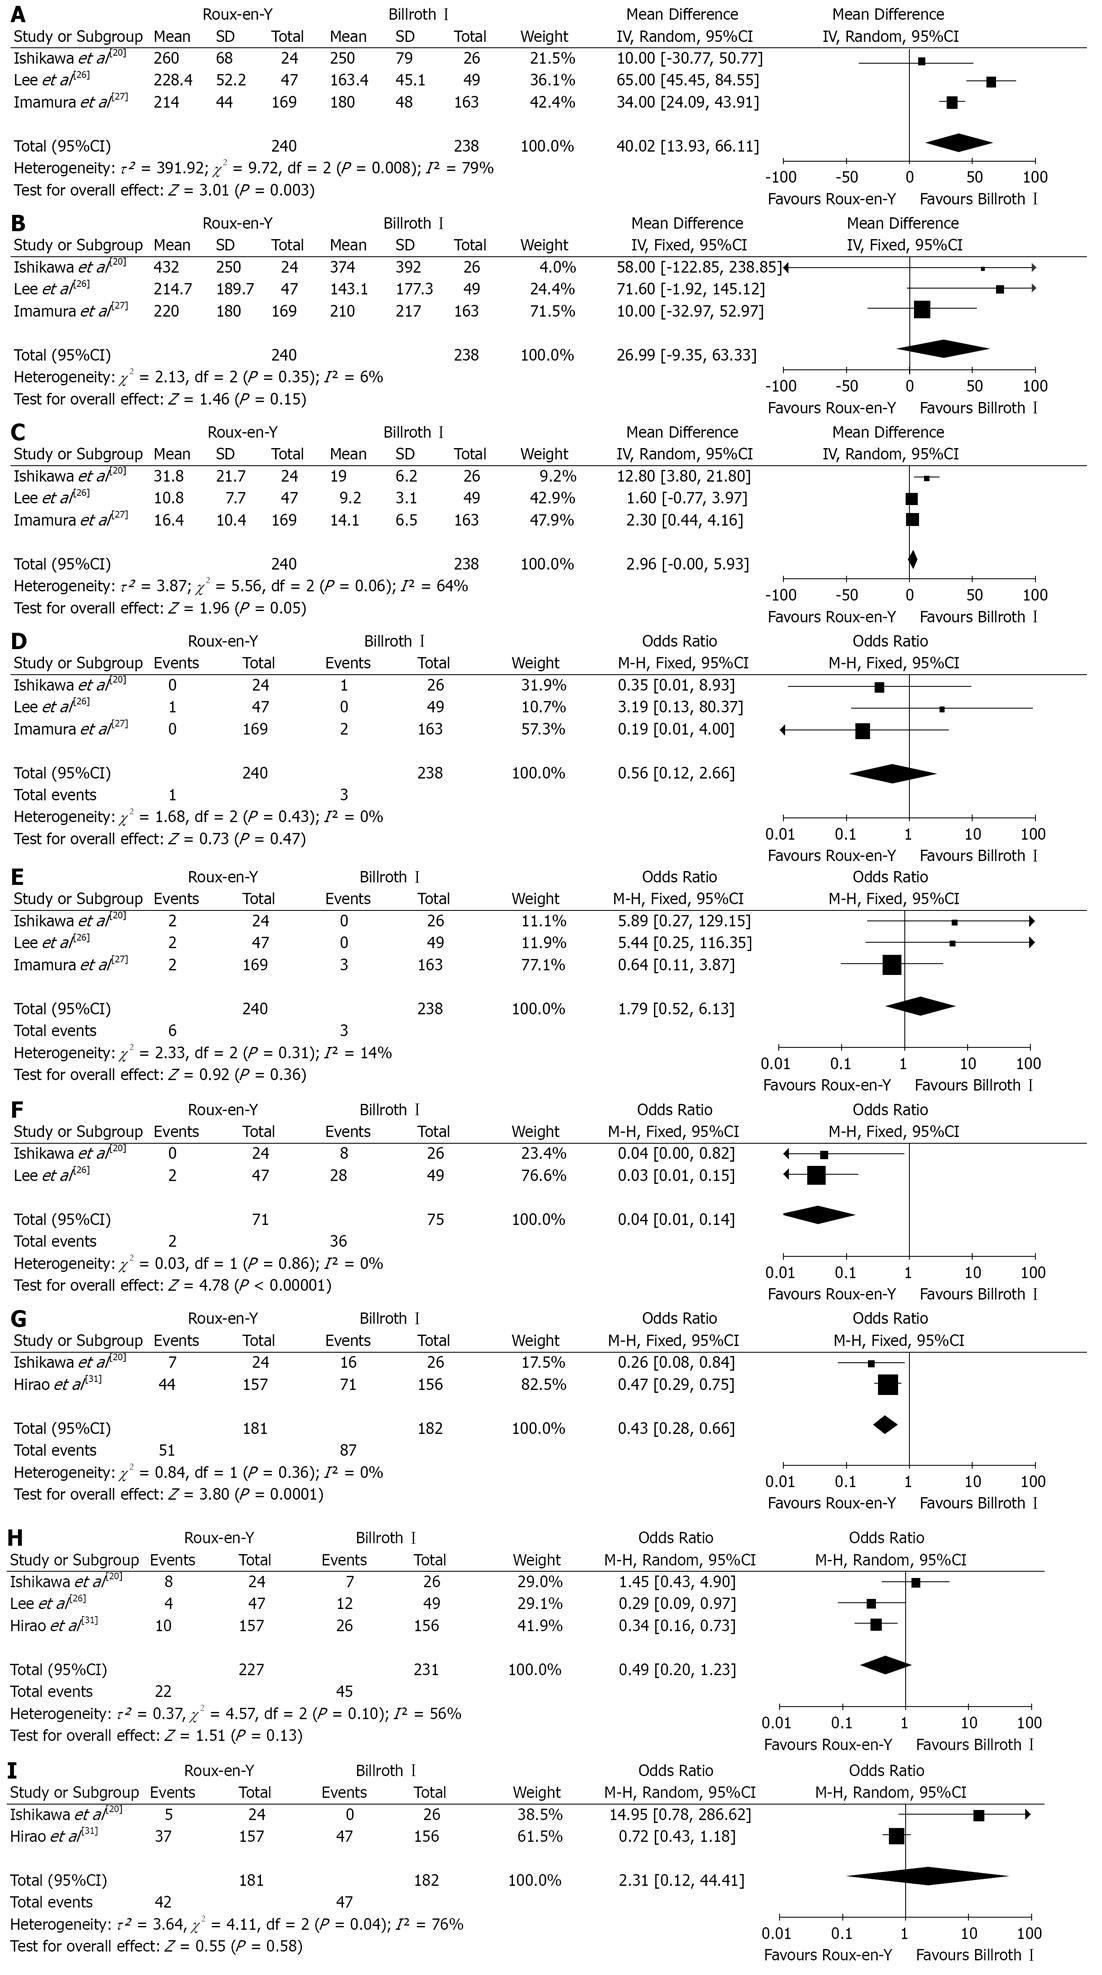
Figure 2 Roux-en-Y versus Billroth I-randomized controlled trials comparison.
A: Operation time; B: Intraoperative blood loss; C: Hospital stay; D: Anastomotic leakage; E: Anastomotic stricture; F: Bile reflux; G: Remnant gastritis; H: Reflux esophagitis; I: Delayed gastric emptying. Pooled weighted mean difference (WMD) or odds ratio (OR) with 95%CI was calculated using the fixed-or random effects model.
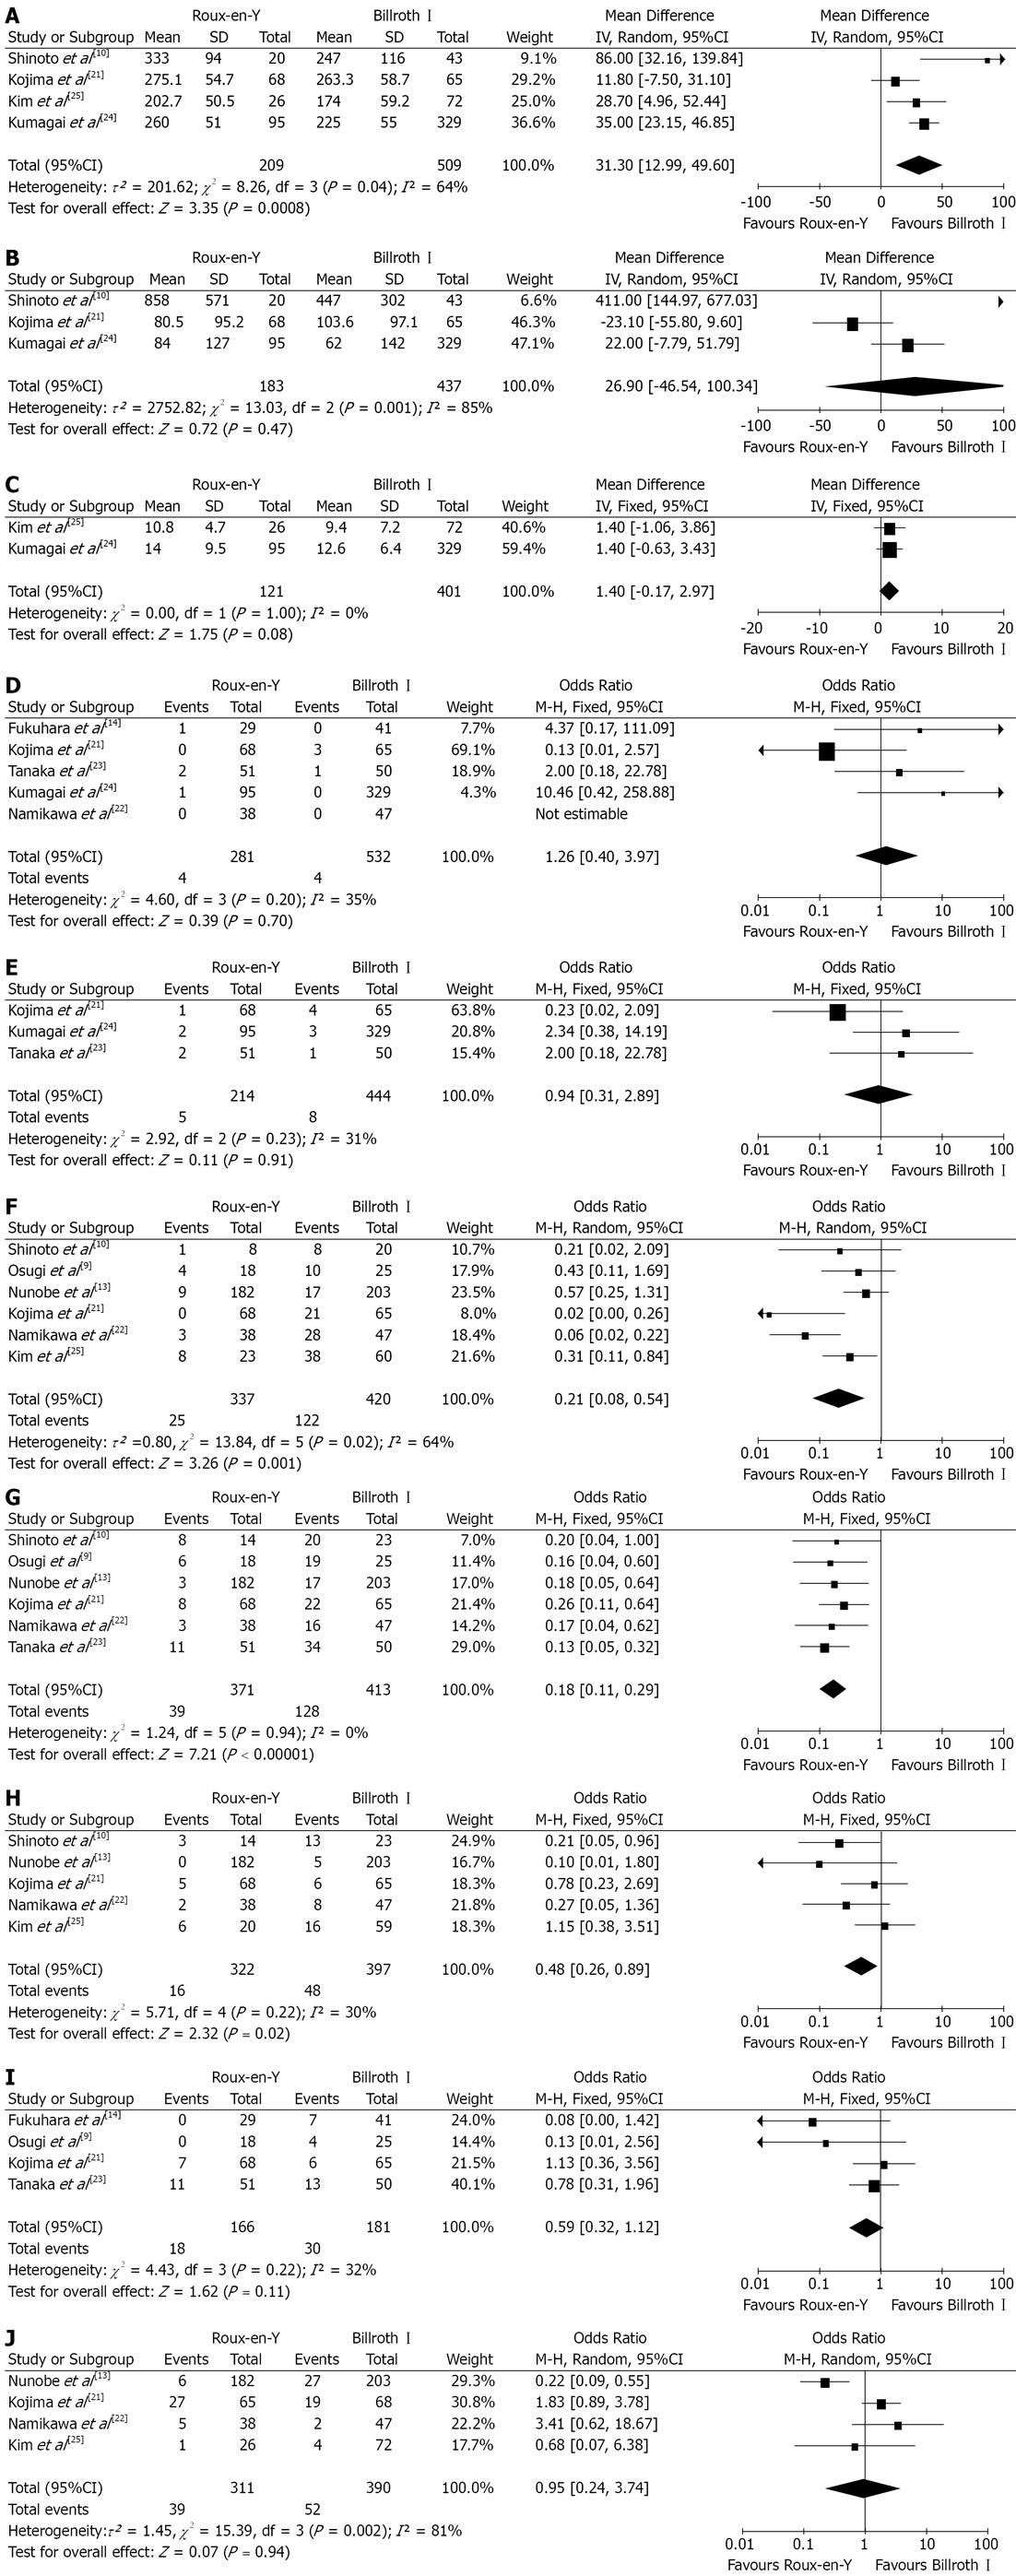
Figure 3 Roux-en-Y versus Billroth I-observational non-randomized clinical studie comparison.
A: Operation time; B: Intraoperative blood loss; C: Hospital stay; D: Anastomotic leakage; E: Anastomotic stricture; F: Bile reflux; G: Remnant gastritis; H: Reflux esophagitis; I: Dumping symptoms; J: Delayed gastric emptying. Pooled weighted mean difference (WMD) or odds ratio (OR) with 95%CI was calculated using the fixed-or random effects model.
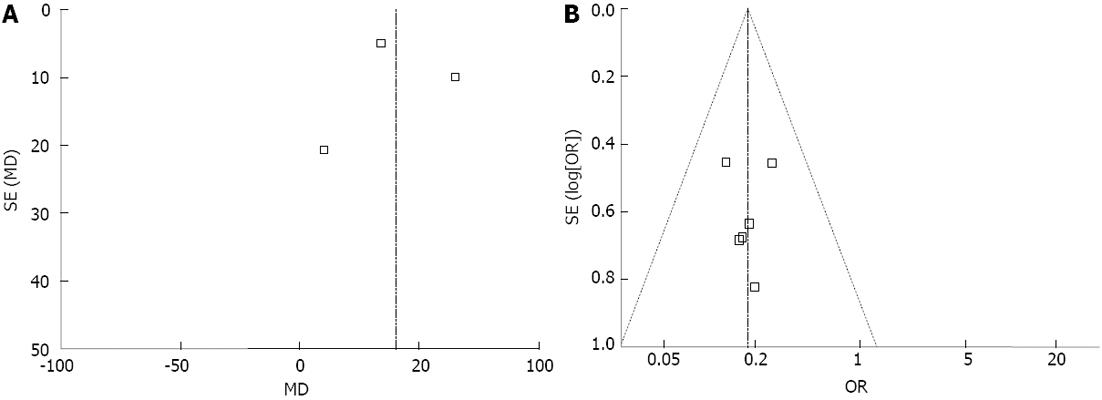
Figure 4 Funnel plot.
A: Operation time-randomized controlled trial; B: Remnant gastritis-observational clinical studies. None of the studies lay outside the limits of the 95%CIs, and there was no evidence of publication bias.
- Citation: Xiong JJ, Altaf K, Javed MA, Nunes QM, Huang W, Mai G, Tan CL, Mukherjee R, Sutton R, Hu WM, Liu XB. Roux-en-Y versus Billroth I reconstruction after distal gastrectomy for gastric cancer: A meta-analysis. World J Gastroenterol 2013; 19(7): 1124-1134
- URL: https://www.wjgnet.com/1007-9327/full/v19/i7/1124.htm
- DOI: https://dx.doi.org/10.3748/wjg.v19.i7.1124


