Copyright
©2013 Baishideng Publishing Group Co.
World J Gastroenterol. Feb 14, 2013; 19(6): 882-888
Published online Feb 14, 2013. doi: 10.3748/wjg.v19.i6.882
Published online Feb 14, 2013. doi: 10.3748/wjg.v19.i6.882
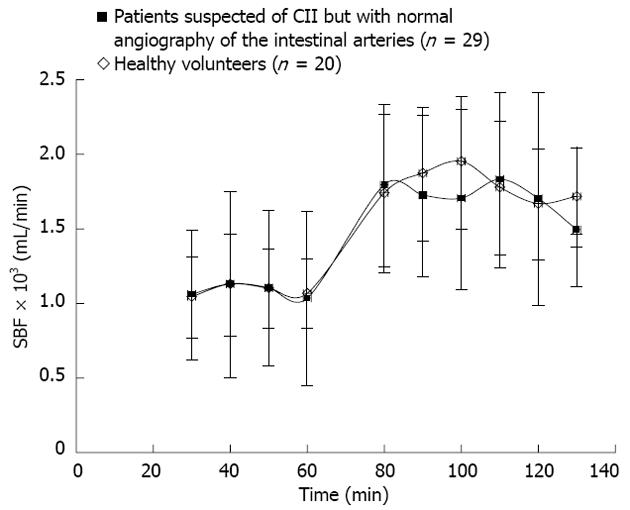
Figure 1 Splanchnic blood flow ± SD at each sampling time.
The standard meal of 4000 kJ was served after 60 min. CII: Chronic intestinal ischemia; SBF: Splanchnic blood flow.
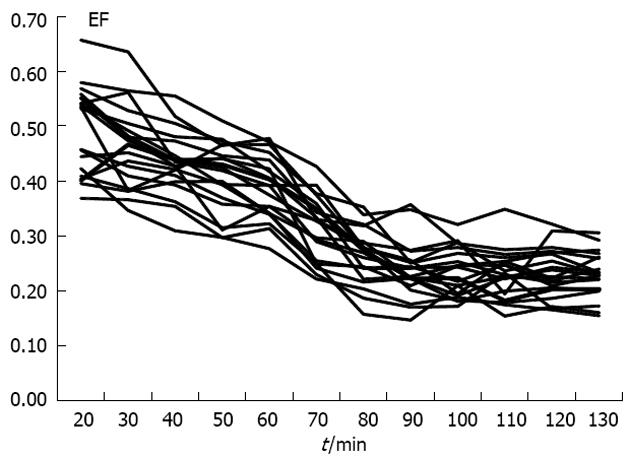
Figure 2 Extraction fraction as a function of time for each of the healthy individuals.
The standard meal is served after 60 min as marked by the line, which causes a sharper decrease in extraction fraction (EF) during the first 20 min after the meal.
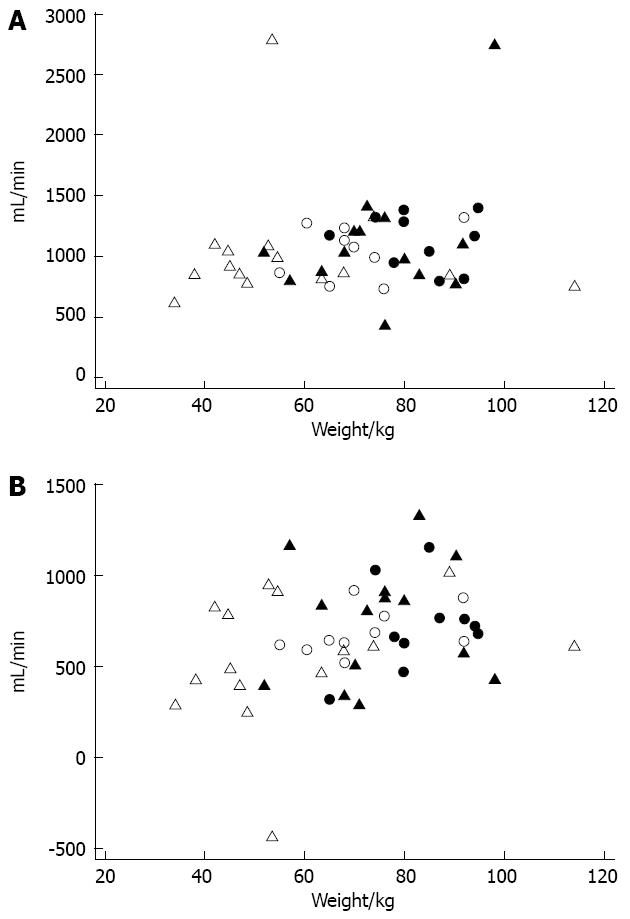
Figure 3 Postprandial increase in splanchnic blood flow for each individual as a function of bodyweight.
A: Baseline splanchnic blood flow (SBF): the linear correlation between bodyweight and baseline SBF is given by the equation. SBF = 858 mL/min + 3.2 mL/min × bodyweight, the correlation is however not significant (P = 0.35); B: Postprandial increase in SBF: the linear correlation between bodyweight and the postprandial increase in SBF can be described by the equation: SBF (increase) = 282 mL/min + bodyweight × 5.4 mL/min (P = 0.025). △: Female patients with normal angiography; ▲: Male patients with normal angiography; 〇: Healthy female volunteers; ●: Healthy male volunteers.
- Citation: Zacho HD, Henriksen JH, Abrahamsen J. Chronic intestinal ischemia and splanchnic blood-flow: Reference values and correlation with body-composition. World J Gastroenterol 2013; 19(6): 882-888
- URL: https://www.wjgnet.com/1007-9327/full/v19/i6/882.htm
- DOI: https://dx.doi.org/10.3748/wjg.v19.i6.882


