Copyright
©2013 Baishideng Publishing Group Co.
World J Gastroenterol. Feb 7, 2013; 19(5): 781-783
Published online Feb 7, 2013. doi: 10.3748/wjg.v19.i5.781
Published online Feb 7, 2013. doi: 10.3748/wjg.v19.i5.781
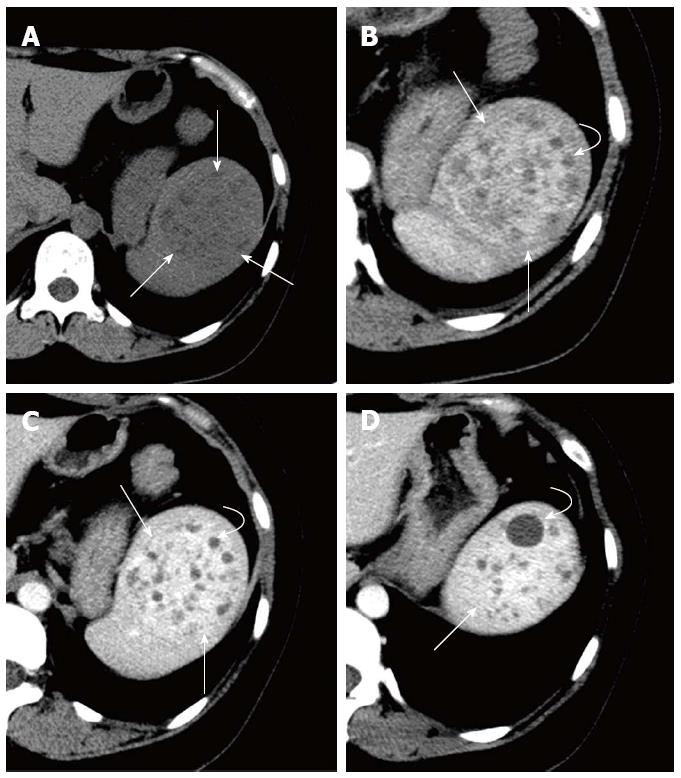
Figure 1 Computed tomography findings of the splenic lymphangioma.
A: A heterogeneous solid-cystic mass (straight arrow) with a well-defined margin in the spleen, as shown in the plain image. The solid components show slight hypo-density; B: Arterial phase image shows the mass (straight arrow) with multiple non-enhanced cysts (curved arrow). The solid portions manifest as obvious enhancement; C: Parenchyma phase image shows obviously progressive enhancement of the solid portions; D: Parenchyma phase image of the upper location of the mass showing the same presentation and enhancement pattern.
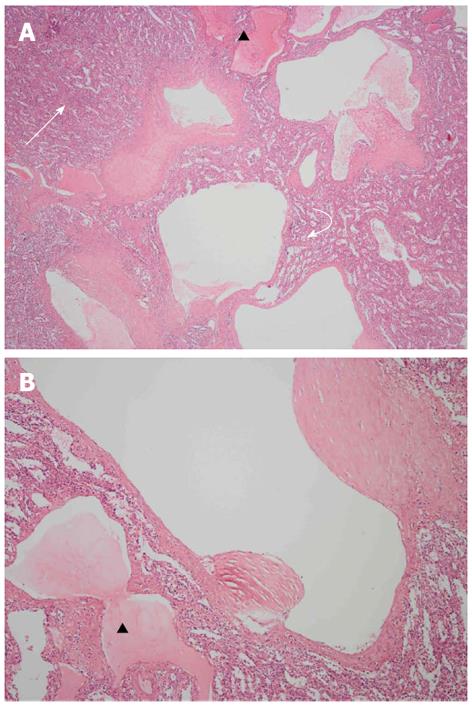
Figure 2 Histopathological findings of the splenic lymphangioma.
A: Hematoxylin and eosin (HE) staining of the splenic lymphangioma, × 40, indicates the presence of numerous cystic lesions of variable size, and blood sinuses (curved arrow) in the red pulp within the mass that are dilated as compared with peripheral red pulp (straight arrow); B: HE staining, × 100, indicates that some vesicles are filled with pink eosinophilic lymph sacs (black triangle).
- Citation: Yang F, Chen WX. Splenic lymphangioma that manifested as a solid-cystic mass: A case report. World J Gastroenterol 2013; 19(5): 781-783
- URL: https://www.wjgnet.com/1007-9327/full/v19/i5/781.htm
- DOI: https://dx.doi.org/10.3748/wjg.v19.i5.781


