Copyright
©2013 Baishideng Publishing Group Co.
World J Gastroenterol. Feb 7, 2013; 19(5): 742-749
Published online Feb 7, 2013. doi: 10.3748/wjg.v19.i5.742
Published online Feb 7, 2013. doi: 10.3748/wjg.v19.i5.742
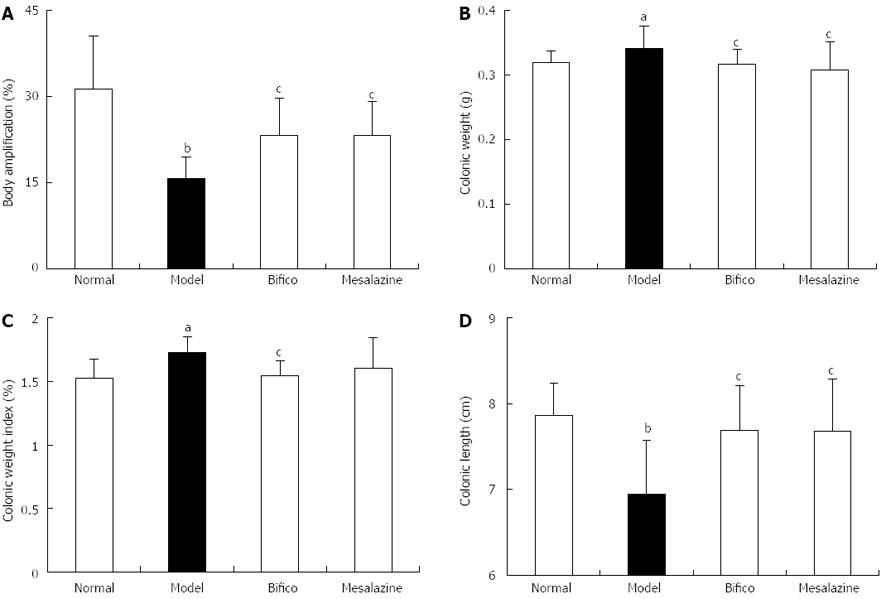
Figure 1 Change of body weight amplification, colonic weight index, colonic weight and colonic length.
A: Percent of body weight amplification; B: Colonic weight; C: Colonic weight index; D: Colonic length. Normal: In the normal group, the animals were administrated with physiological saline; Model: In the model group, the animals were challenged with 2,4,6-trinitrobenzene sulfonic acid (TNBS) without treatment; Bifico: In the Bifico group, the animals were challenged by TNBS and treated with Bifico at 345 mg/kg; Mesalazine: In the Mesalazine group, the animals were challenged by TNBS and treated with 300 mg/kg Mesalazine. Data are means ± SE (n = 10). aP < 0.05, bP < 0.01 vs the normal group; cP < 0.05 vs the model group.
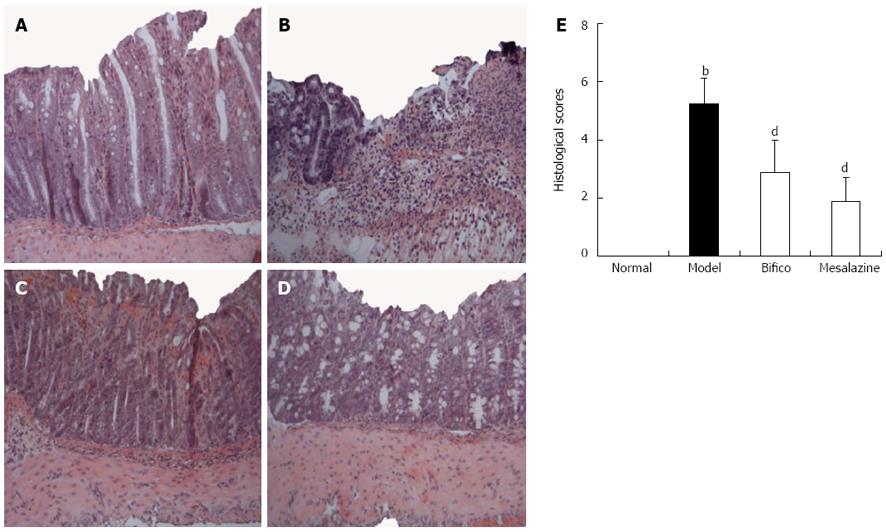
Figure 2 Representative histological images and scores of mice.
A: The normal group; B: The model group; C: The bifico group; D: The mesalazine group; E: Histological images and scores (hematoxylin and eosin, light microscope, × 100). Normal: In the normal group, the animals were administrated with physiological saline; Model: In the model group, the animals were challenged with 2,4,6-trinitrobenzene sulfonic acid (TNBS) without treatment; Bifico: In the Bifico group, the animals were challenged by TNBS and treated with Bifico at 345 mg/kg; Mesalazine: In the Mesalazine group, the animals were challenged by TNBS and treated with 300 mg/kg mesalazine. Data are means ± SE (n = 10). bP < 0.01 vs the normal group; dP < 0.01 vs the model group.
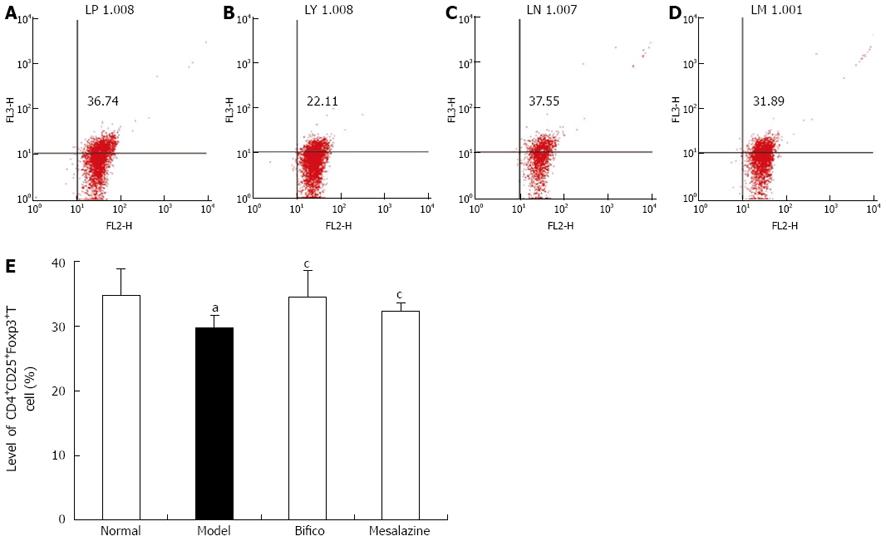
Figure 3 Representative flow plots and level of CD4+CD25+Foxp3+T cell.
A: The normal group; B: The model group; C: The bifico group; D: The mesalazine group; E: The level of CD4+CD25+Foxp3+T. Normal: In the normal group, the animals were administrated with physiological saline; Model: In the model group, the animals were challenged with 2,4,6-trinitrobenzene sulfonic acid (TNBS) without treatment; Bifico: In the Bifico group, the animals were challenged by TNBS and treated with Bifico at 345 mg/kg; Mesalazine: In the Mesalazine group, the animals were challenged by TNBS and treated with 300 mg/kg Mesalazine. Data are means ± SE (n = 10). aP < 0.05 vs the normal group; cP < 0.05 vs the model group.
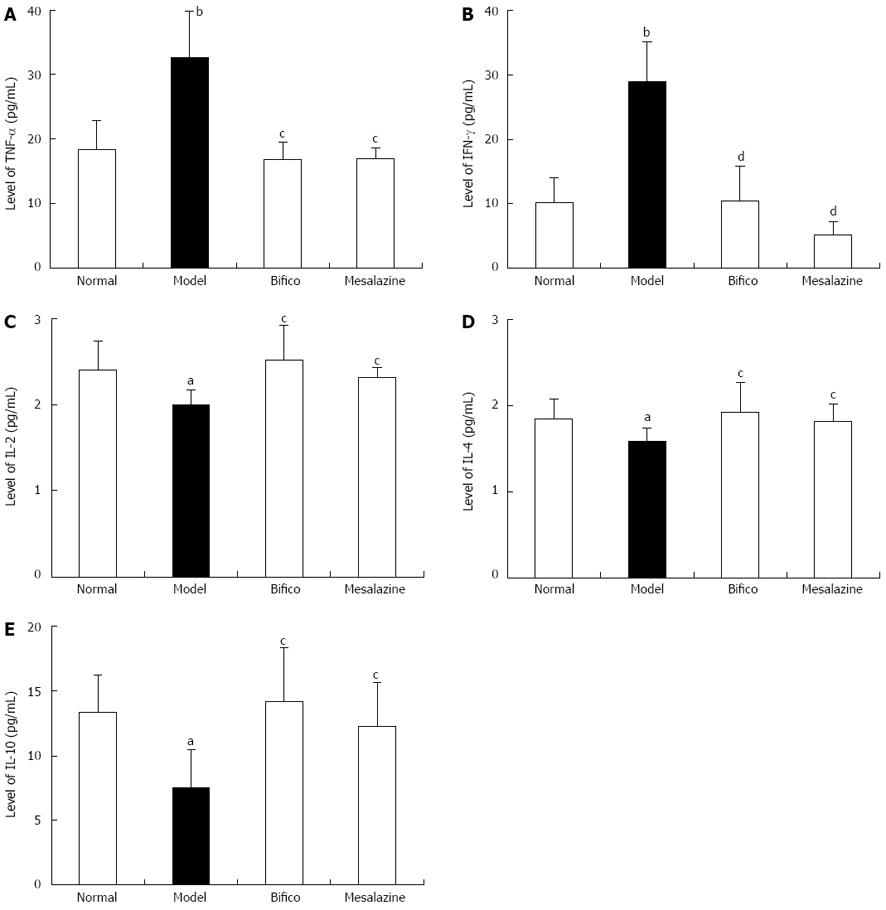
Figure 4 Expression of cytokines in colonic mucosa.
A: Level of tumor necrosis factor (TNF)-α; B: Level of interferon (IFN)-γ; C: Level of interleukin (IL)-2; D: Level of IL-4; E: Level of IL-10. Normal: In the normal group, the animals were administrated with physiological saline; Model: In the model group, the animals were challenged with 2,4,6-trinitrobenzene sulfonic acid (TNBS) without treatment; Bifico: In the Bifico group, the animals were challenged by TNBS and treated with Bifico at 345 mg/kg; Mesalazine: In the Mesalazine group, the animals were challenged by TNBS and treated with 300 mg/kg Mesalazine. Data are the means ± SE (n = 10). aP < 0.05, bP < 0.01 vs the normal group; cP < 0.05, dP < 0.01 vs the model group.
- Citation: Zhao HM, Huang XY, Zuo ZQ, Pan QH, Ao MY, Zhou F, Liu HN, Liu ZY, Liu DY. Probiotics increase T regulatory cells and reduce severity of experimental colitis in mice. World J Gastroenterol 2013; 19(5): 742-749
- URL: https://www.wjgnet.com/1007-9327/full/v19/i5/742.htm
- DOI: https://dx.doi.org/10.3748/wjg.v19.i5.742


