Copyright
©2013 Baishideng Publishing Group Co.
World J Gastroenterol. Feb 7, 2013; 19(5): 692-705
Published online Feb 7, 2013. doi: 10.3748/wjg.v19.i5.692
Published online Feb 7, 2013. doi: 10.3748/wjg.v19.i5.692
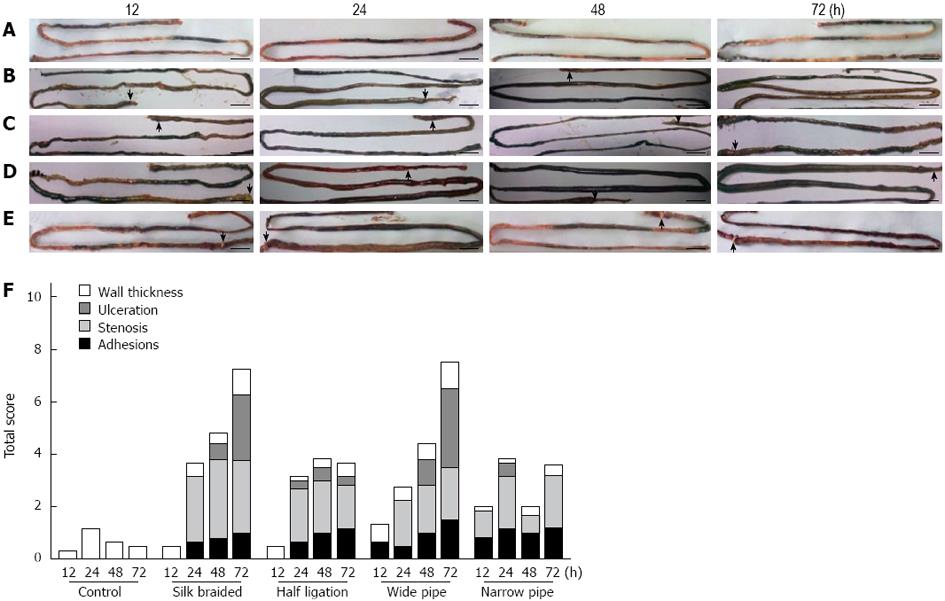
Figure 1 Dissection of the entire intestine from the pyloric antrum to the ileocecal valve in the obstructed and control rats.
A: Control; B: Braided silk; C: Half ligation; D: Wide pipe; E: Narrow pipe. Rats were killed at different time points after surgery; F: The morphological score of changes in the extent and severity of adhesions, stenosis, ulceration and bowel wall thickness. The arrow indicates the portion of obstructed intestine bearing a ring (scale bar: 1 cm).
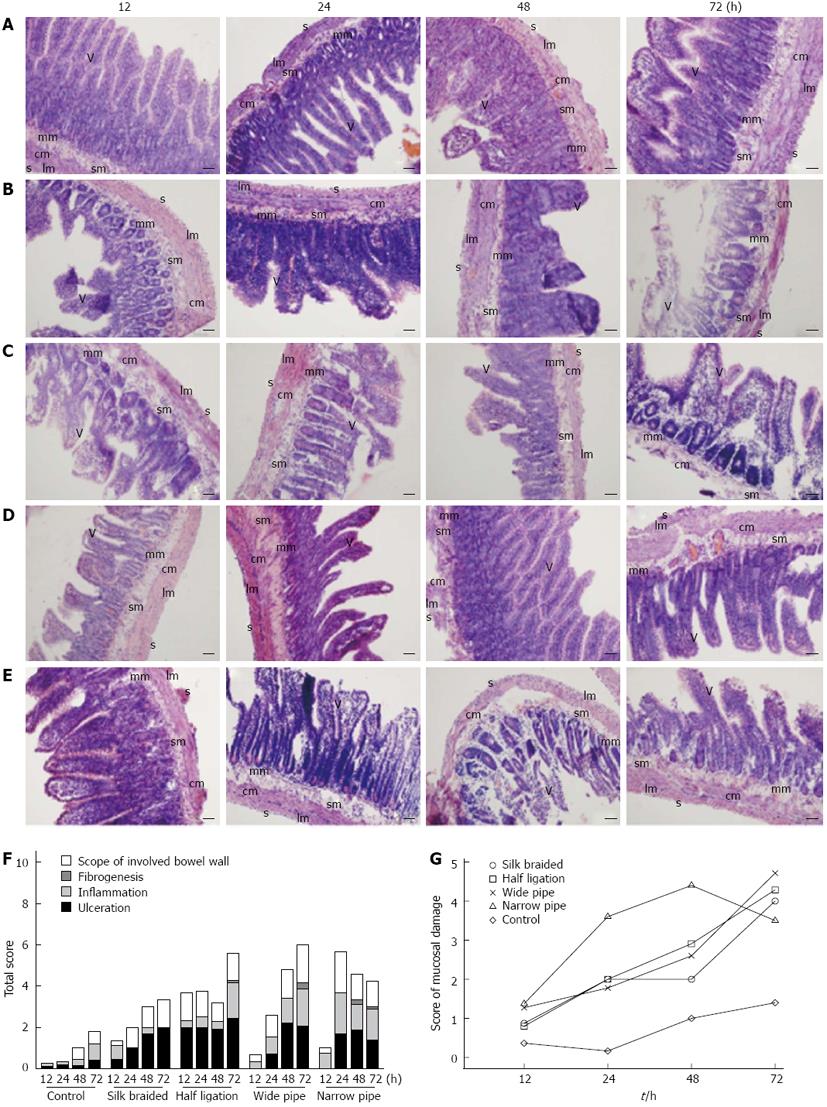
Figure 2 Cross-section of the ileum in obstructed and control rat tissues stained with hematoxylin-eosin.
A: Control; B: Braided silk; C: Half ligation; D: Wide pipe; E: Narrow pipe. Rats were killed at different time points after surgery; F: The histopathological score of changes in the extent and severity of ulceration, inflammation, fibrogenesis and scope of involved bowel wall; G: Analytical data of the total scores of intestinal damage following histological mucosal damage in obstructed and control rats. (scale bar: 20 μm).
Figure 3 Average ileal wet weight and circumference in the obstructed and control rats.
A: The average values for the ileal circumference in the dilated portion of the obstruction rat tissue were significantly larger than those in the corresponding portion of the controls (P < 0.01); B: In the obstructed intestine, there was a marked increase in the wet weight due to thickening of the muscle layers. When the groups were compared, these increases were most obvious in the braided silk group, followed by the wide pipe, the narrow pipe group and the half ligation group.
Figure 4 Changes in spontaneous rhythmic contractions.
Original traces of rhythmic contractions in obstructed and control ileum. A: Control; B: Braided silk; C: Half ligation; D: Wide pipe; E: Narrow pipe. The data illustrate typical traces of spontaneous contractions at different time points; F: Data showing ileal contractility of spontaneous rhythmic motility; G: Data of intestinal transit ratio showing movement capability in vivo.
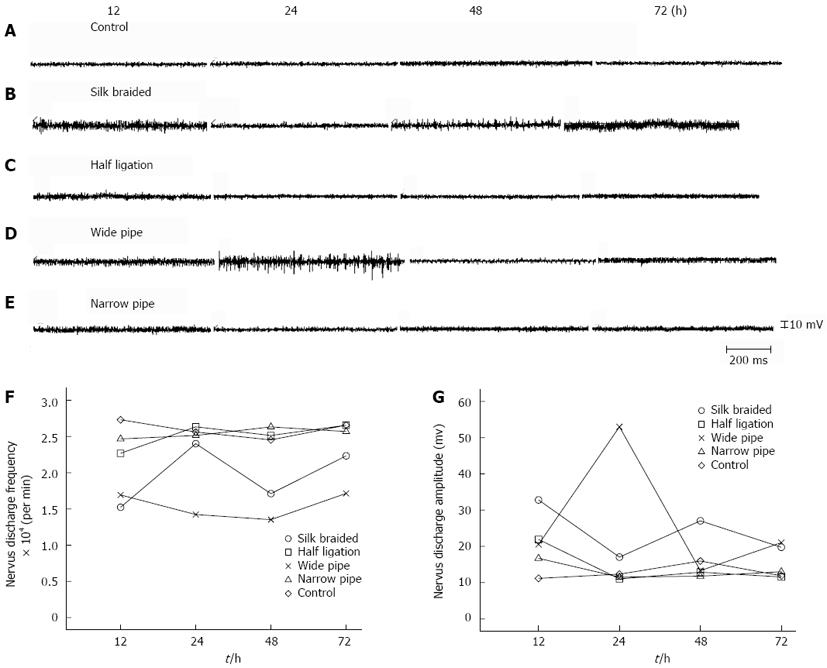
Figure 5 Changes in autonomic nerve electrical discharge.
Original traces of the vagus nerve in the obstructed and control ileum. A: Control; B: Braided silk; C: Half ligation; D: Wide pipe; E: Narrow pipe. The data illustrate typical traces of autonomic electrical discharge at different time points; F: Data of frequency of vagus electrical discharge showing autonomic nerve electrical activity; G: Data of amplitude of vagus electrical discharge showing autonomic nerve electrical activity.
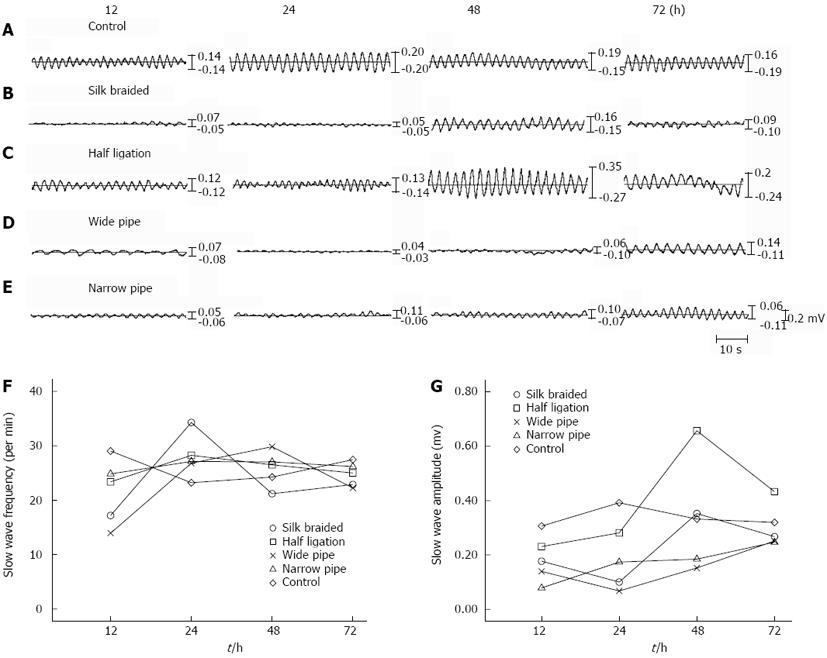
Figure 6 Change in pacemaker activity in the ileum.
Typical intracellular electrical activity (slow waves) recorded in the small intestine of control rats and at 12-72 h at the site of intestinal obstruction. A: Control; B: Braided silk; C: Half ligation; D: Wide pipe; E: Narrow pipe; F: Data on slow wave frequency in normal functioning tissue away from the obstruction site; G: Slow-wave amplitude was markedly reduced near the site of obstruction and increased in amplitude in normal functioning tissue away from the obstruction site.
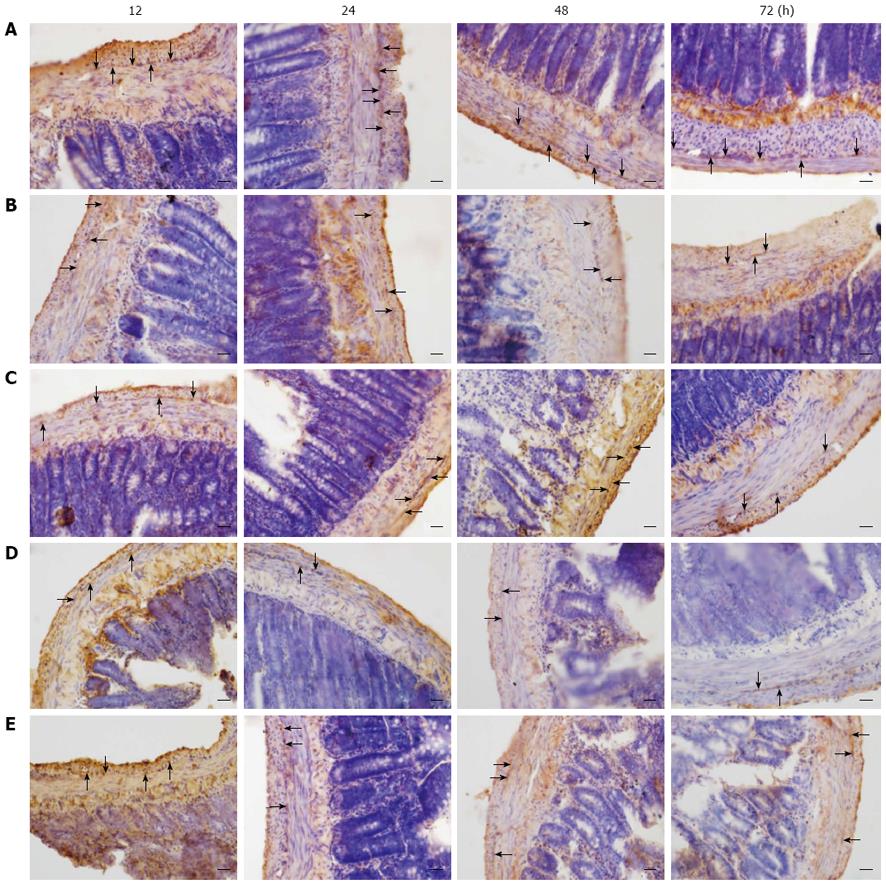
Figure 7 Immunohistochemistry of c-Kit positive interstitial cells of Cajal (arrow) in whole mount preparations of ileum in the obstructed and control rats.
A: Control; B: Braided silk; C: Half ligation; D: Wide pipe; E: Narrow pipe. Rats were killed at different time points after surgery. Each panel shows c-Kit positive interstitial cells of Cajal at different times (scale bar: 20 μm).
- Citation: Yuan ML, Yang Z, Li YC, Shi LL, Guo JL, Huang YQ, Kang X, Cheng JJ, Chen Y, Yu T, Cao DQ, Pang H, Zhang X. Comparison of different methods of intestinal obstruction in a rat model. World J Gastroenterol 2013; 19(5): 692-705
- URL: https://www.wjgnet.com/1007-9327/full/v19/i5/692.htm
- DOI: https://dx.doi.org/10.3748/wjg.v19.i5.692


