Copyright
©2013 Baishideng Publishing Group Co.
World J Gastroenterol. Dec 28, 2013; 19(48): 9383-9391
Published online Dec 28, 2013. doi: 10.3748/wjg.v19.i48.9383
Published online Dec 28, 2013. doi: 10.3748/wjg.v19.i48.9383
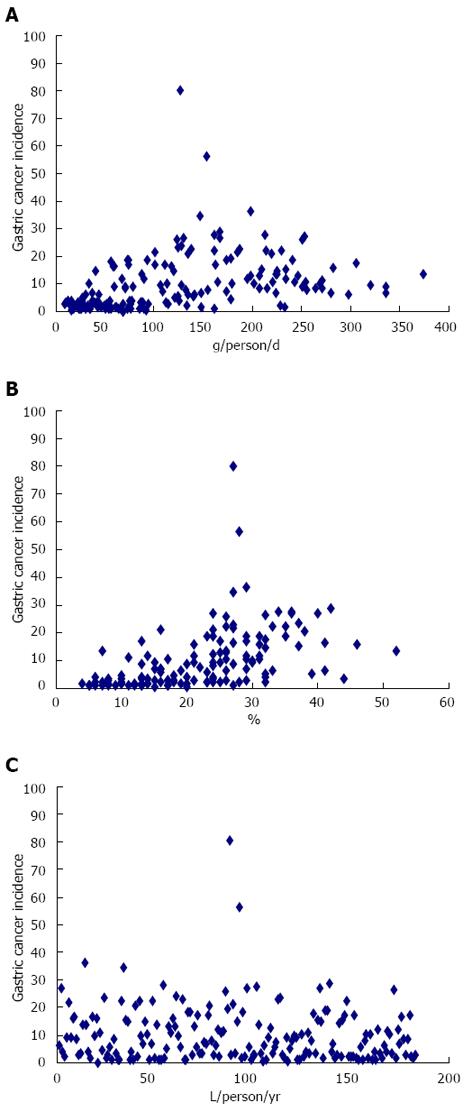
Figure 1 Several of the scatter plots.
A: Meat; B: Tobacco; C: Alcohol.
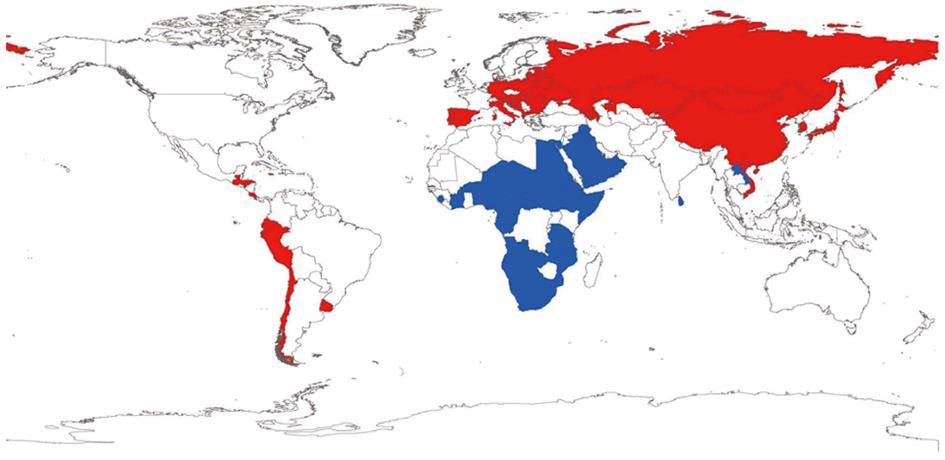
Figure 2 World map of countries with extreme incidences of gastric cancer.
Blue: Countries categorized as < P25; Red: Countries categorized as > P75.
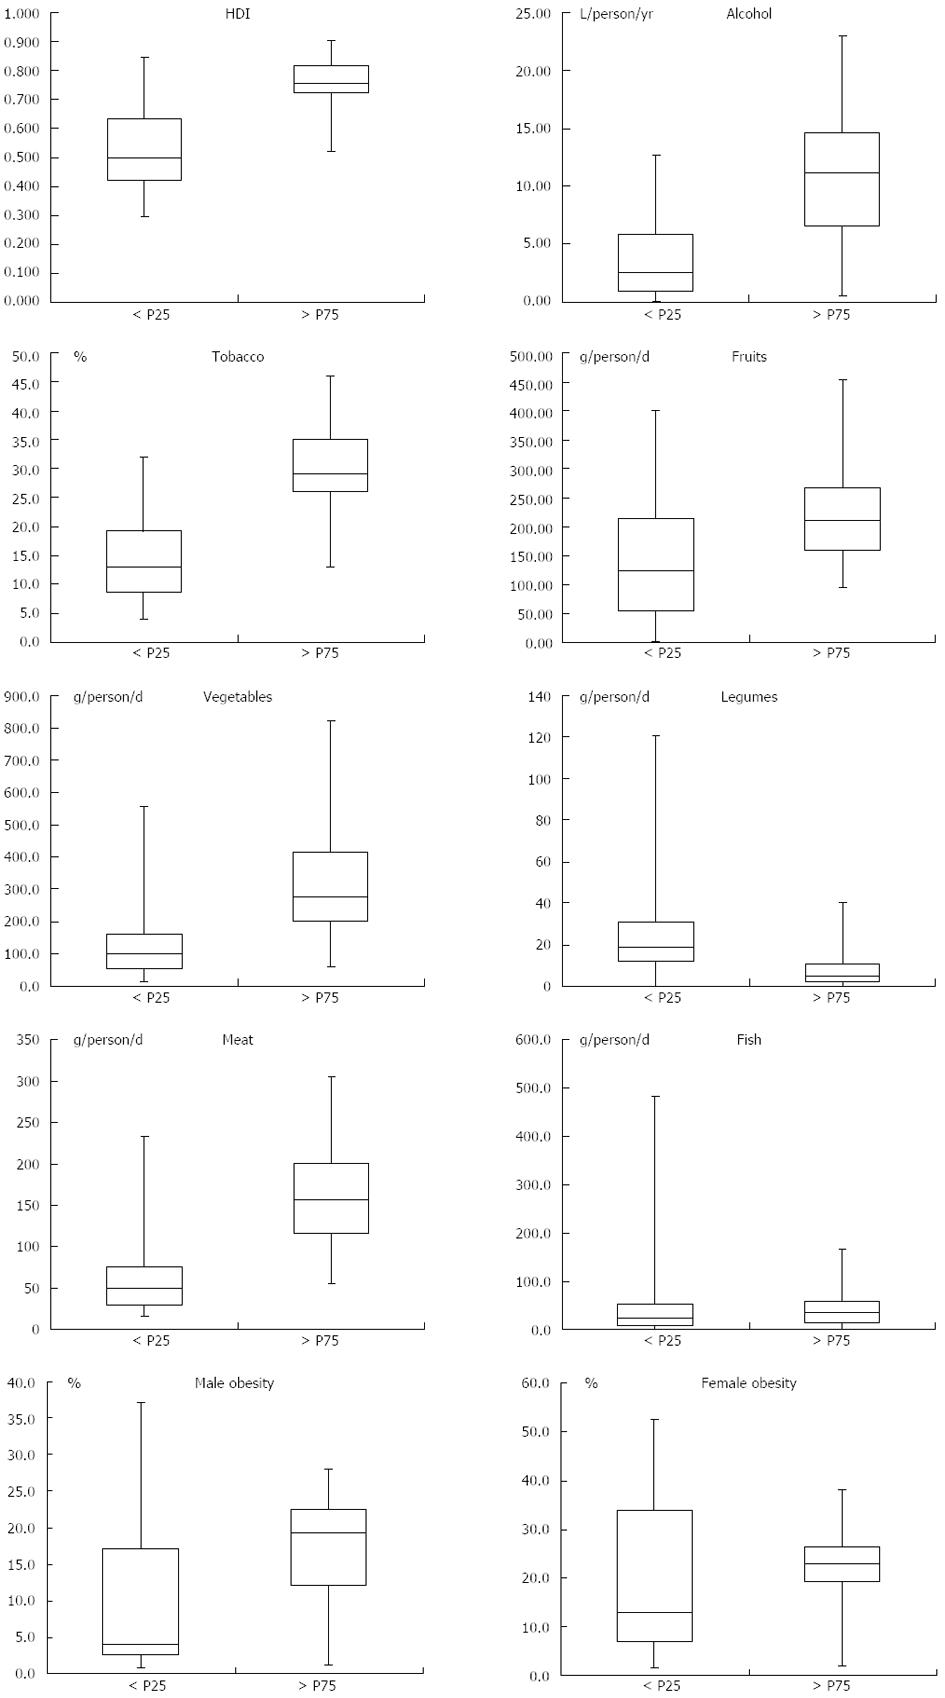
Figure 3 Boxplot diagrams of human development index values.
the consumption of alcohol, tobacco, fruits, vegetables, legumes, meat and fish; and the prevalence of obesity in males and females among countries with gastric cancer incidences < P25 and > P75.
- Citation: Ferrari F, Reis MAM. Study of risk factors for gastric cancer by populational databases analysis. World J Gastroenterol 2013; 19(48): 9383-9391
- URL: https://www.wjgnet.com/1007-9327/full/v19/i48/9383.htm
- DOI: https://dx.doi.org/10.3748/wjg.v19.i48.9383


