Copyright
©2013 Baishideng Publishing Group Co.
World J Gastroenterol. Dec 28, 2013; 19(48): 9351-9358
Published online Dec 28, 2013. doi: 10.3748/wjg.v19.i48.9351
Published online Dec 28, 2013. doi: 10.3748/wjg.v19.i48.9351
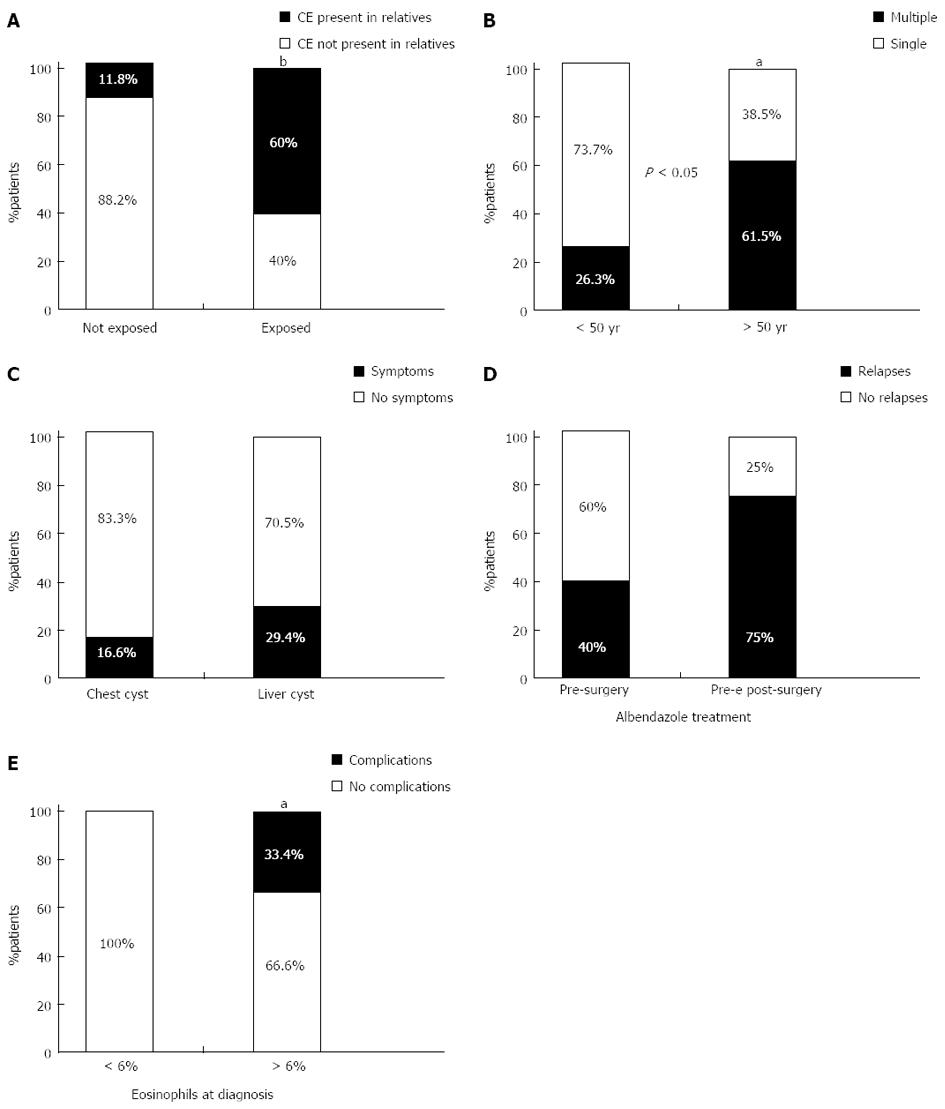
Figure 1 Correlation between different groups.
A: Correlation between exposure of patients to risk factors and presence of relatives affected by cystic echinococcosis (CE); B: Correlation between age at diagnosis and presence of single or multiple CE; C: Correlation between cysts location and presence of symptomatic CE; D: Correlation between treatment modality and development of relapses; E: Correlation between rate of eosinophils at diagnosis and development of complications. aP < 0.05, bP < 0.01 vs control group.
- Citation: Cappello E, Cacopardo B, Caltabiano E, Volsi SL, Chiara R, Sapienza M, Nigro L. Epidemiology and clinical features of cystic hydatidosis in Western Sicily: A ten-year review. World J Gastroenterol 2013; 19(48): 9351-9358
- URL: https://www.wjgnet.com/1007-9327/full/v19/i48/9351.htm
- DOI: https://dx.doi.org/10.3748/wjg.v19.i48.9351


