Copyright
©2013 Baishideng Publishing Group Co.
World J Gastroenterol. Dec 28, 2013; 19(48): 9294-9306
Published online Dec 28, 2013. doi: 10.3748/wjg.v19.i48.9294
Published online Dec 28, 2013. doi: 10.3748/wjg.v19.i48.9294
Figure 2 Phylogenetic relationships among complete preS1/pre S2/S sequences (nt 2854-835 numbering according to GenBank accession AY233274).
A: Subgenotype A1 from hepatitis B virus (HBV) positive patients from Kerala (marked in bold) compared with sequences obtained from GenBank established using the neighbor joining method; B: Genotype D isolates from HBV positive patients from Kerala (marked in bold) compared with HBV isolates obtained from GenBank established using the neighbor joining method. Bootstrap statistical analysis was performed using 1000 replicates. Each sequence obtained from GenBank is designated by its accession number and its country of origin. The characteristic amino acids in the preS1 and polymerase spacer regions are indicated next to the sequences or relevant clades.
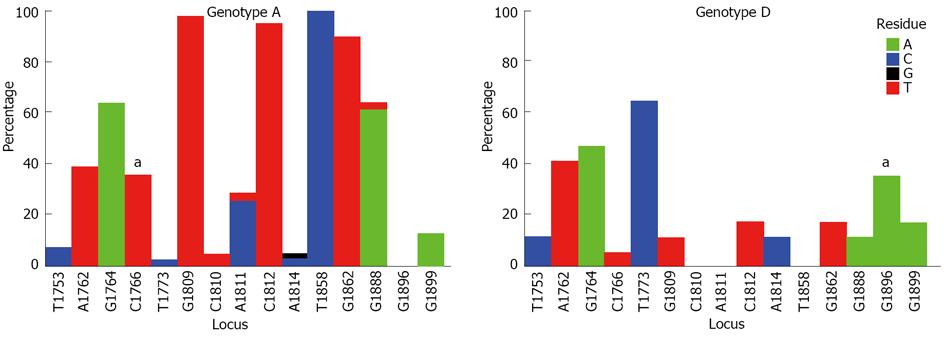
Figure 3 Comparison of the distribution of mutations in the basic core promoter/precore region (1742-1901 from the EcoR1 site) in genotypes A (62 isolates) and D (23 isolates).
Graphs showing the percentage of mutant residues relative to the reference motif found at the 15 loci of interest (1753, 1762, 1764, 1766, 1773, 1809-1812, 1814, 1858, 1862, 1888, 1896 and 1899). The study sequence files were submitted to the Mutation Reporter Tool[49] to produce the graphs. The reference motifs used were TAGCTGCACACGGGG (genotype A) and TAGCTGCACATGGGG (genotype D) for comparison. This is also shown by the letter preceding each locus on the X-axis. To facilitate direct comparisons between the graphs, conserved loci were not suppressed and the Y-axis was scaled to 100% by selecting the appropriate controls on the input page of the Mutation Reporter Tool. Nucleotides: A (green), C (dark blue), G (black), T (red). aSignificantly associated with the respective genotype.
- Citation: Gopalakrishnan D, Keyter M, Shenoy KT, Leena KB, Thayumanavan L, Thomas V, Vinayakumar K, Panackel C, Korah AT, Nair R, Kramvis A. Hepatitis B virus subgenotype A1 predominates in liver disease patients from Kerala, India. World J Gastroenterol 2013; 19(48): 9294-9306
- URL: https://www.wjgnet.com/1007-9327/full/v19/i48/9294.htm
- DOI: https://dx.doi.org/10.3748/wjg.v19.i48.9294


