Copyright
©2013 Baishideng Publishing Group Co.
World J Gastroenterol. Dec 7, 2013; 19(45): 8335-8341
Published online Dec 7, 2013. doi: 10.3748/wjg.v19.i45.8335
Published online Dec 7, 2013. doi: 10.3748/wjg.v19.i45.8335
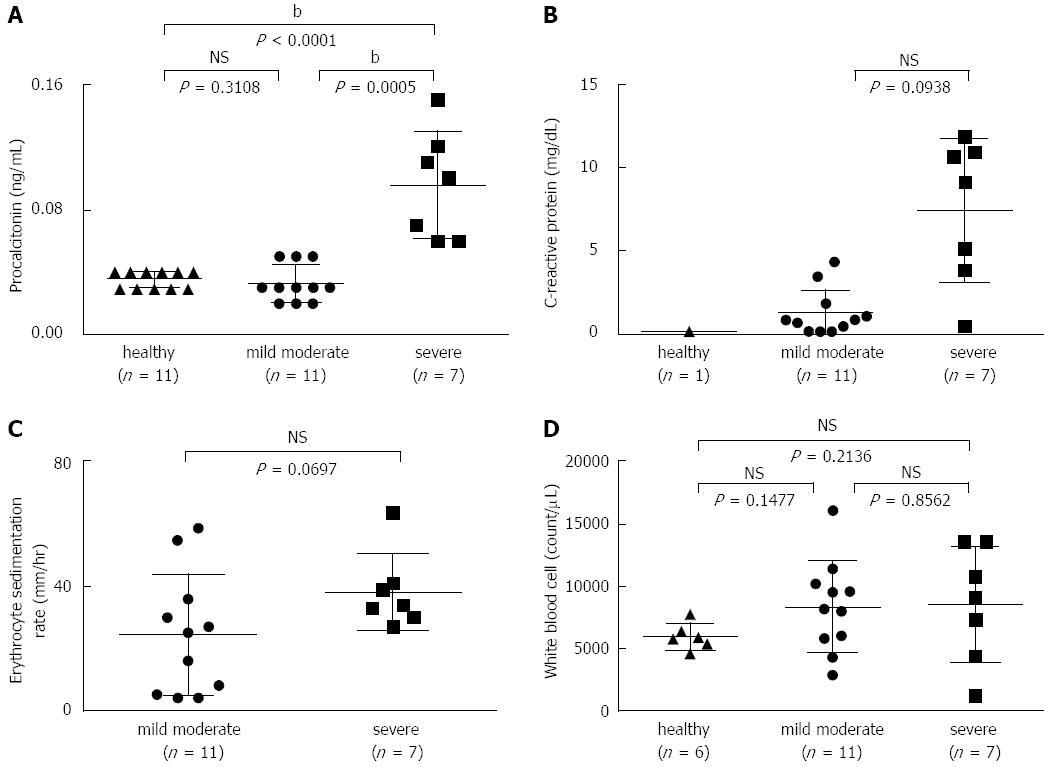
Figure 1 Scatter dot plot of biological markers in mild-to-moderate and severe ulcerative colitis patients.
A: Procalcitonin (PCT) levels; B: C-reactive protein levels (CRP); C: The erythrocyte sedimentation rate (ESR); D: The total white blood cell (WBC) count were examined in healthy volunteers or mild-to-moderate and severe ulcerative colitis patients. Serum PCT levels in healthy volunteers were used as a control. Based on our laboratory reference, the normal limits for the other inflammatory variables were a CRP level of 0.0-0.3 mg/dL, a WBC count of 3300-8600 count/μL, and an ESR of 2-19 mm/h. The results are expressed as the mean ± SD. bP < 0.01 vs healthy or mild-to-moderate group. NS: Not significant.
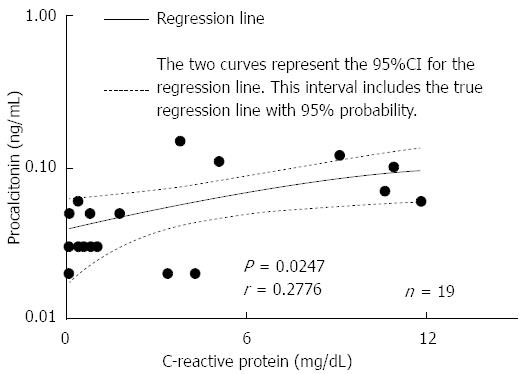
Figure 2 Correlation of serum procalcitonin levels with C-reactive protein levels in patients with ulcerative colitis.
The two curves represent the 95%CI for the regression line. This interval includes the true regression line, with a 95% probability. There was a significant correlation between procalcitonin (ng/mL) and C-reactive protein (mg/dL) levels (r = 0.2776, P = 0.0247).
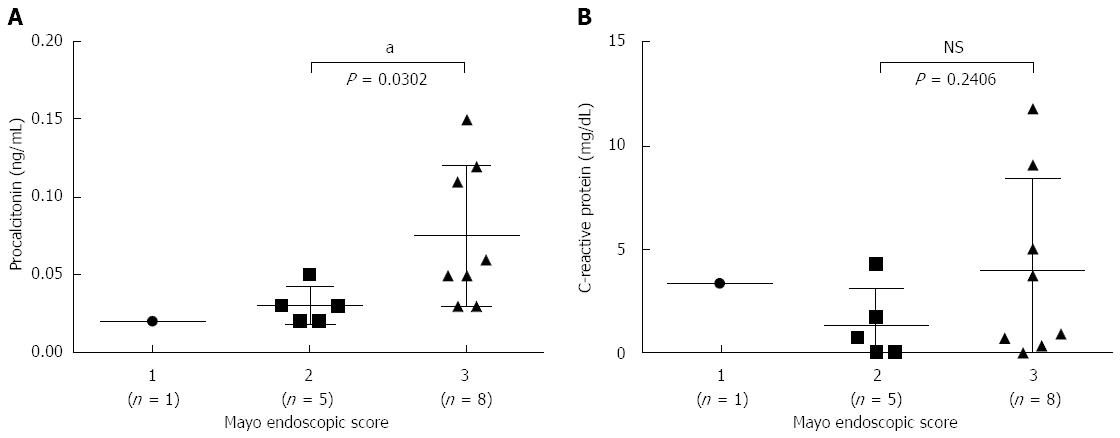
Figure 3 Serum procalcitonin and C-reactive protein levels in patients with Mayo endoscopic subscore of 2 or 3 points.
A: Procalcitonin; B: C-reactive protein levels were examined in patients with a Mayo endoscopic subscore of 1 (n = 1), 2 (n = 5), or 3 (n = 8) points. The results are expressed as the mean ± SD. aP < 0.05 vs score 2 group. NS: Not significant.
- Citation: Koido S, Ohkusa T, Takakura K, Odahara S, Tsukinaga S, Yukawa T, Mitobe J, Kajihara M, Uchiyama K, Arakawa H, Tajiri H. Clinical significance of serum procalcitonin in patients with ulcerative colitis. World J Gastroenterol 2013; 19(45): 8335-8341
- URL: https://www.wjgnet.com/1007-9327/full/v19/i45/8335.htm
- DOI: https://dx.doi.org/10.3748/wjg.v19.i45.8335


