Copyright
©2013 Baishideng Publishing Group Co.
World J Gastroenterol. Nov 28, 2013; 19(44): 8114-8132
Published online Nov 28, 2013. doi: 10.3748/wjg.v19.i44.8114
Published online Nov 28, 2013. doi: 10.3748/wjg.v19.i44.8114
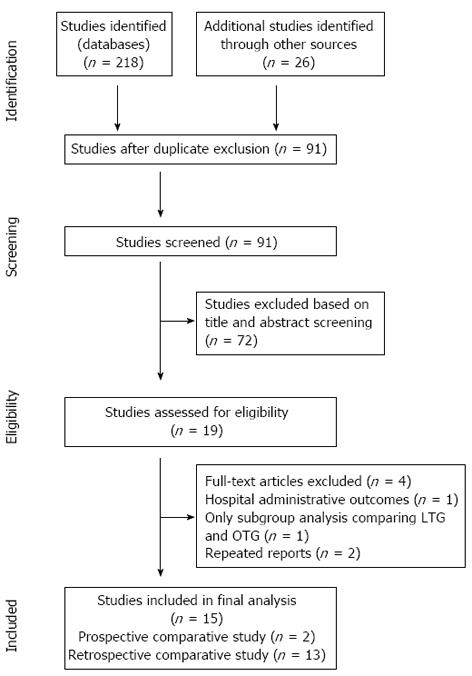
Figure 1 Flow diagram outlining the study selection process according to PRISMA guidelines.
OTG: Open total gastrectomy; LTG: Laparoscopic total gastrectomy.
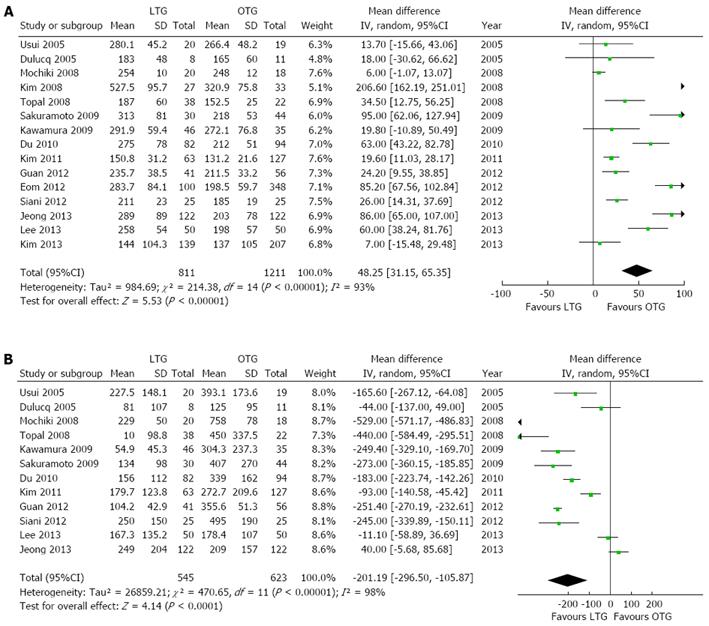
Figure 2 Forest plots illustrating results of operative outcomes in the form of a meta-analysis comparing laparoscopic total gastrectomy vs open total gastrectomy for gastric cancer.
Pooled weighted mean difference (WMD) with 95%CI was calculated using the random effects model. A: Operation time; B: Intraoperative blood loss. LTG: Laparoscopic total gastrectomy; OTG: Open total gastrectomy.
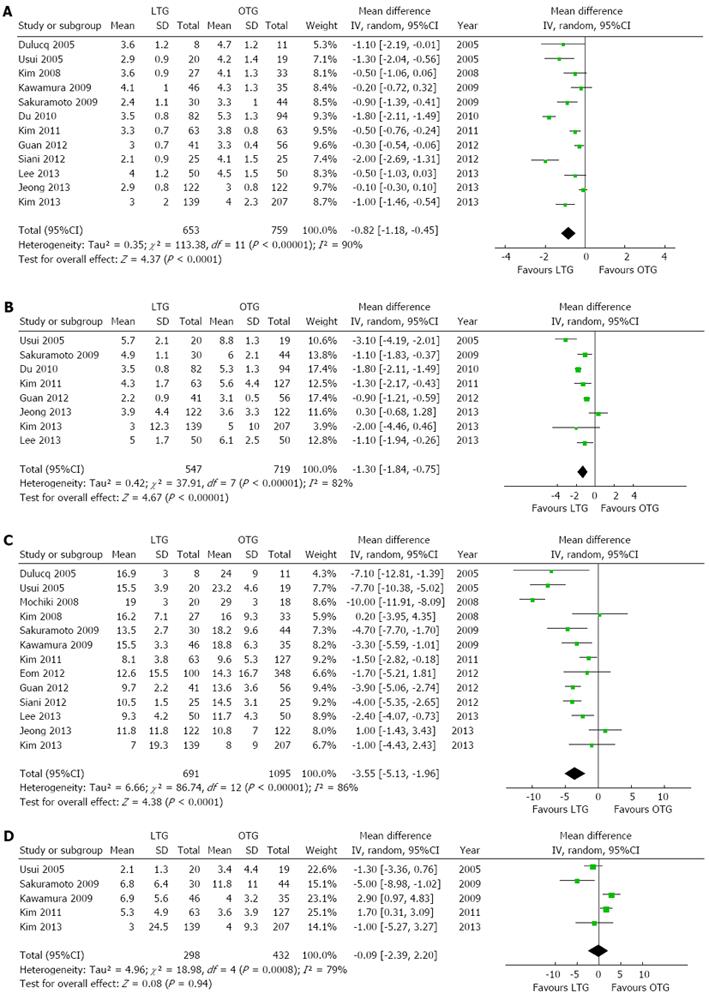
Figure 3 Forest plots illustrating results of postoperative recovery in the form of a meta-analysis comparing laparoscopic total gastrectomy vs open total gastrectomy for gastric cancer.
Pooled weighted mean difference (WMD) with 95%CI was calculated using the random-effects model. A: Time to first flatus; B Time to first oral intake; C: Hospital stay; D: Analgesic use. LTG: Laparoscopic total gastrectomy; OTG: Open total gastrectomy.
Figure 4 Forest plots illustrating results of postoperative complications in the form of a meta-analysis comparing laparoscopic total gastrectomy vs open total gastrectomy for gastric cancer.
Pooled odds ratio (OR) with 95%CI was calculated using the fixed-effects model. A: Overall complication rate; B: Anastomotic leak; C: Anastomotic Stenosis; D: Ileus; E: Bleeding; F: Abdominal abscess; G: Wound-related complications; H: Mortality. LTG: Laparoscopic total gastrectomy; OTG: Open total gastrectomy.
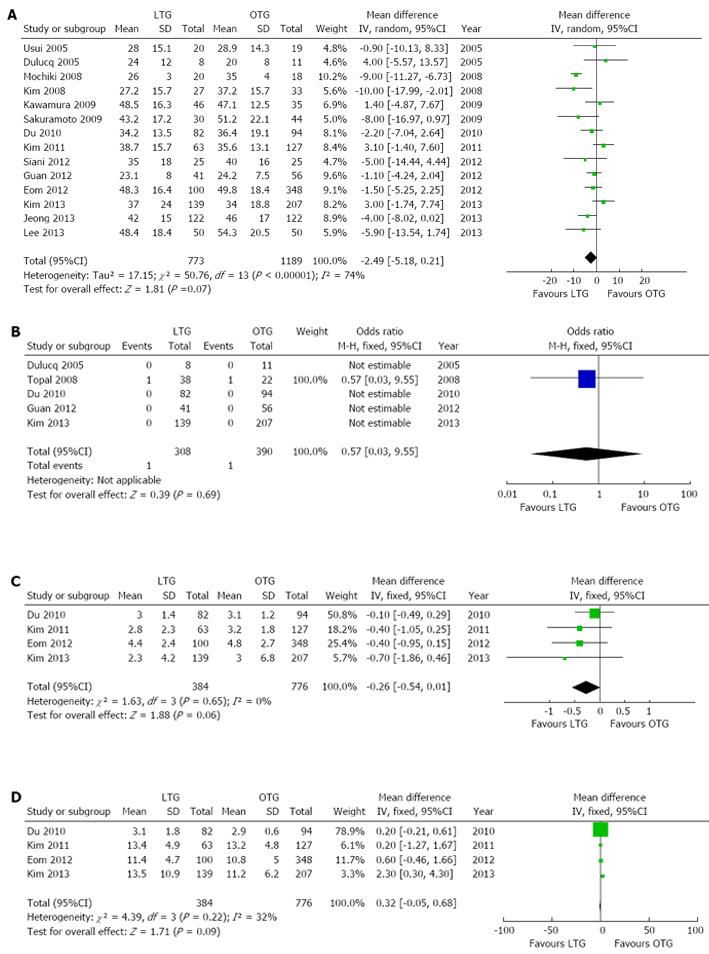
Figure 5 Forest plots illustrating results of oncological outcomes in the form of a meta-analysis comparing laparoscopic total gastrectomy vs open total gastrectomy for gastric cancer.
Pooled weighted mean difference (WMD) or odds ratio (OR) with 95%CI were calculated using the fixed or random-effects model. A: No. of resected lymph nodes; B: Positive resection margins; C: Proximal resection margin; D: Distal resection margin. LTG: Laparoscopic total gastrectomy; OTG: Open total gastrectomy.
Figure 6 Forest plots illustrating results of all outcomes in the form of a meta-analysis comparing laparoscopic total gastrectomy vs open total gastrectomy for gastric cancer.
Pooled weighted mean difference (WMD) or odds ratio (OR) with 95%CI were calculated using the fixed or random-effects model. A: Operation time; B: Intraoperative blood loss; C: Time to first flatus; D: Time to first oral intake; E: Hospital stay; F: Analgesics use; G: Postoperative complications; H: No. of resected lymph nodes; I: Proximal resection margin; J: Distal resection margin; K: Positive resection margins; L: Anastomotic leakage; M: Anastomotic Stenosis; N: Ileus; O: Bleeding; P: Abdominal abscess; Q: Wound-related complications; R: Mortality. LTG: Laparoscopic total gastrectomy; OTG: Open total gastrectomy.
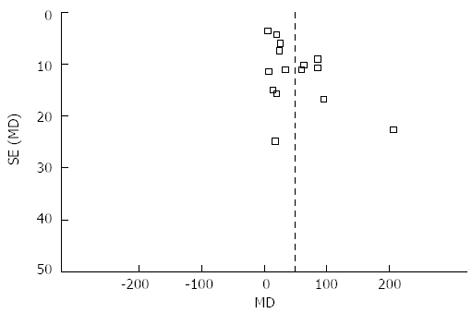
Figure 7 Funnel plot of operation time of all included studies.
-
Citation: Xiong JJ, Nunes QM, Huang W, Tan CL, Ke NW, Xie SM, Ran X, Zhang H, Chen YH, Liu XB. Laparoscopic
vs open total gastrectomy for gastric cancer: A meta-analysis. World J Gastroenterol 2013; 19(44): 8114-8132 - URL: https://www.wjgnet.com/1007-9327/full/v19/i44/8114.htm
- DOI: https://dx.doi.org/10.3748/wjg.v19.i44.8114


