Copyright
©2013 Baishideng Publishing Group Co.
World J Gastroenterol. Nov 21, 2013; 19(43): 7671-7679
Published online Nov 21, 2013. doi: 10.3748/wjg.v19.i43.7671
Published online Nov 21, 2013. doi: 10.3748/wjg.v19.i43.7671
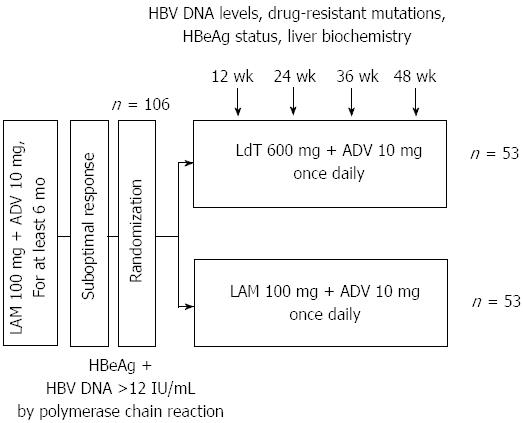
Figure 1 Flow diagram of study participants.
LMA: Lamivudine; ADV: Adefovir; LdT: Telbivudine; HBV: High hepatitis B virus; HBeAg: Hepatitis Be antigen.
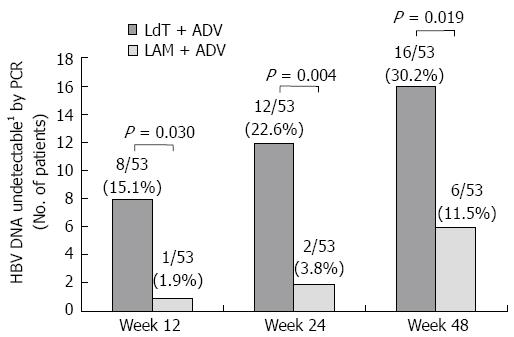
Figure 2 Proportion of patients with undetectable serum hepatitis B virus DNA (< 12 IU/mL) over time.
1Undetectable < 12 IU/mL. LAM: Lamivudine; ADV: Adefovire; HBV: High hepatitis B virus; LdT: Telbivudine; PCR: Polymerase chain reaction.
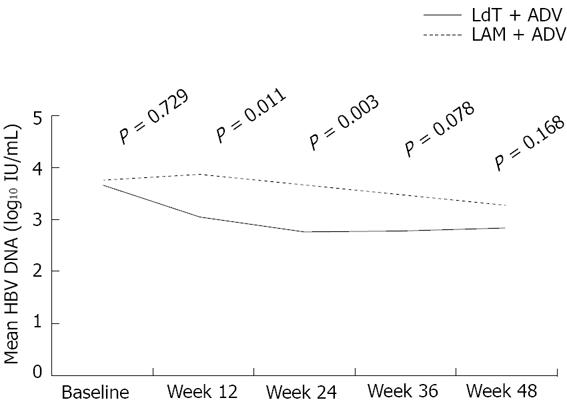
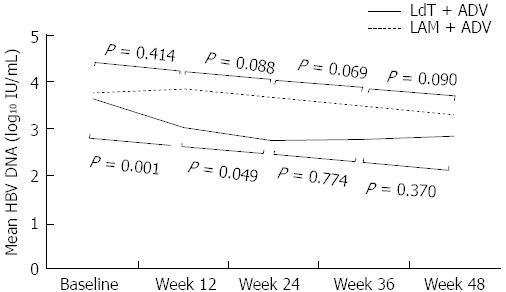
Figure 3 Mean hepatitis B virus DNA levels over time in the two groups.
LAM: Lamivudine; ADV: Adefovire; HBV: Hepatitis B virus; LdT: Telbivudine.
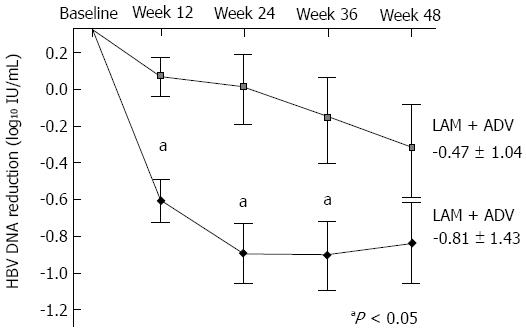
Figure 4 Mean reduction of serum hepatitis B virus DNA levels from baseline.
Mean hepatitis B virus (HBV) DNA (log10 IU/mL) were plotted over time. Error bars indicate the standard deviation (aP value < 0.05). LAM: Lamivudine; ADV: Adefovire; LdT: Telbivudine.
Figure 5 Estimated glomerular filtration rate over time in the two groups (A), and proportion of patients with estimated glomerular filtration rate ≥ 90 mL/min per 1.
73 m2 at baseline and week 48 (B). LAM: Lamivudine; ADV: Adefovire; HBV: High hepatitis B virus; LdT: Telbivudine. GFR: Glomerular filtration rate
Figure 6 Serial changes of mean serum hepatitis B virus DNA levels.
Serum hepatitis B virus DNA levels decreased significantly not only from baseline to 12 wk but also from 12 wk to 24 wk in the LdT + ADV group. LAM: Lamivudine; ADV: Adefovire; HBV: High hepatitis B virus; LdT: Telbivudine.
- Citation: Park H, Park JY, Kim SU, Kim DY, Han KH, Chon CY, Ahn SH. Efficacy of switching to telbivudine plus adefovir in suboptimal responders to lamivudine plus adefovir. World J Gastroenterol 2013; 19(43): 7671-7679
- URL: https://www.wjgnet.com/1007-9327/full/v19/i43/7671.htm
- DOI: https://dx.doi.org/10.3748/wjg.v19.i43.7671


