Copyright
©2013 Baishideng Publishing Group Co.
World J Gastroenterol. Oct 14, 2013; 19(38): 6438-6446
Published online Oct 14, 2013. doi: 10.3748/wjg.v19.i38.6438
Published online Oct 14, 2013. doi: 10.3748/wjg.v19.i38.6438
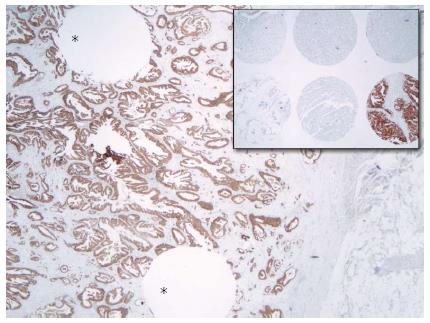
Figure 1 Photomicrograph of immunohistochemistry (× 100) in a whole-tissue section.
Asterisks indicate two round voids where the tissue microarray cores (inset) were extracted.
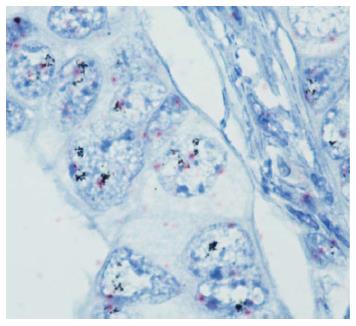
Figure 2 Dual-color in situ hybridization (× 1000), human epidermalgrowth factor receptor 2 amplification.
Black dots: Human epidermalgrowth factor receptor 2 gene; Pink dots: Chromosome 17.
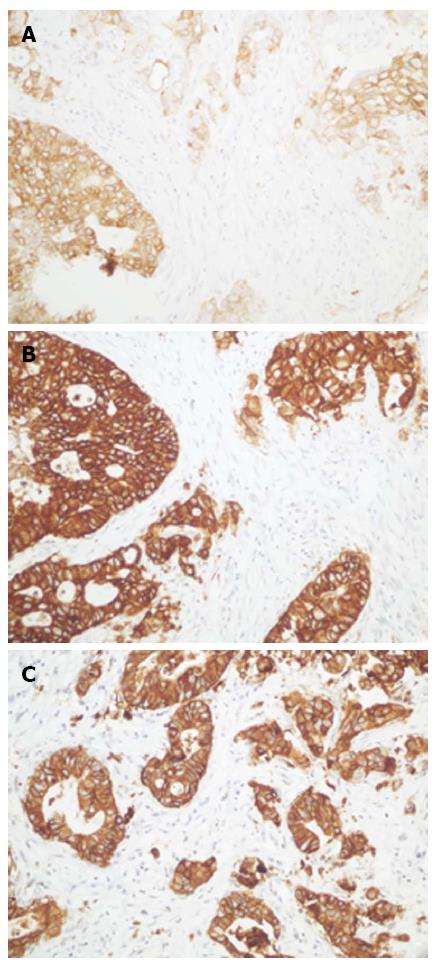
Figure 3 Comparison of positivity (3+) using the HercepTest (A), 4B5 (B) and SP3 (C) antibodies (× 200).
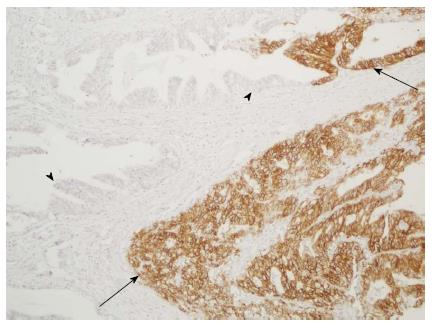
Figure 4 Representative image of the intratumoral heterogeneity of HER2 expression (× 100).
Arrows indicate areas with strong continuous membranous staining (score 3+) and arrowheads indicate negative areas (score 0).
- Citation: Abrahão-Machado LF, Jácome AADA, Wohnrath DR, Santos JSD, Carneseca EC, Fregnani JHTG, Scapulatempo-Neto C. HER2 in gastric cancer: Comparative analysis of three different antibodies using whole-tissue sections and tissue microarrays. World J Gastroenterol 2013; 19(38): 6438-6446
- URL: https://www.wjgnet.com/1007-9327/full/v19/i38/6438.htm
- DOI: https://dx.doi.org/10.3748/wjg.v19.i38.6438


