Copyright
©2013 Baishideng Publishing Group Co.
World J Gastroenterol. Sep 14, 2013; 19(34): 5759-5762
Published online Sep 14, 2013. doi: 10.3748/wjg.v19.i34.5759
Published online Sep 14, 2013. doi: 10.3748/wjg.v19.i34.5759
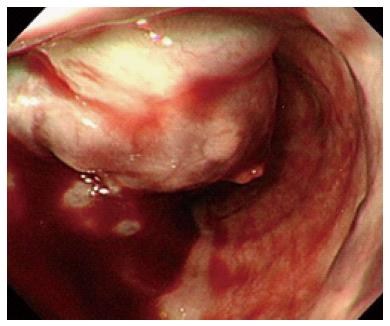
Figure 1 Endoscopy showing a large esophageal varix.
The varix occupies more than half of the esophageal lumen. The adherent, whitish fibrin plug on top of the varix is considered a site of recent hemorrhage.
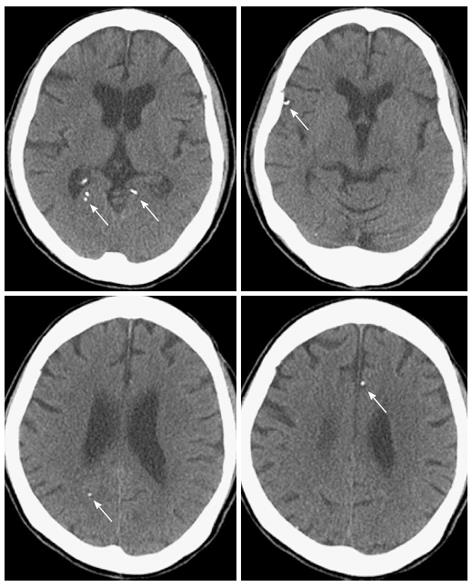
Figure 2 Non-contrast brain computed tomography showing multiple high attenuation lesions (arrows).
The multiple high attenuation lesions are emboli of the Histoacryl-Lipiodol mixture. The high attenuation lesions were seen in the frontal lobe and the parieto-occipital lobe.
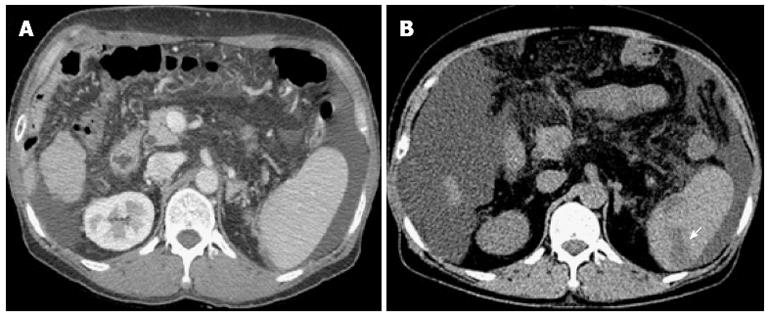
Figure 3 Abdominal computed tomography reveals several wedge-shaped, low attenuation lesions in the spleen, indicating infarction (arrow).
A: Computed tomography (CT) before endoscopic treatment; B: CT after endoscopic treatment.
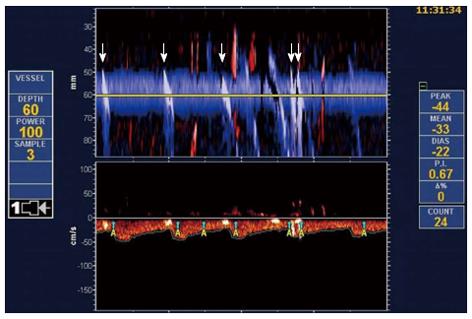
Figure 4 Transcranial Doppler bubble test showing the Doppler flow through the middle cerebral artery.
The embolus is clearly represented in the power M-mode (upper panel) as a whitish sloping track. The whitish sloping track means that microemboli disrupt the ultrasonic signal (arrows).
-
Citation: Myung DS, Chung CY, Park HC, Kim JS, Cho SB, Lee WS, Choi SK, Joo YE. Cerebral and splenic infarctions after injection of
N -butyl-2-cyanoacrylate in esophageal variceal bleeding. World J Gastroenterol 2013; 19(34): 5759-5762 - URL: https://www.wjgnet.com/1007-9327/full/v19/i34/5759.htm
- DOI: https://dx.doi.org/10.3748/wjg.v19.i34.5759


