Copyright
©2013 Baishideng Publishing Group Co.
World J Gastroenterol. Sep 14, 2013; 19(34): 5700-5705
Published online Sep 14, 2013. doi: 10.3748/wjg.v19.i34.5700
Published online Sep 14, 2013. doi: 10.3748/wjg.v19.i34.5700
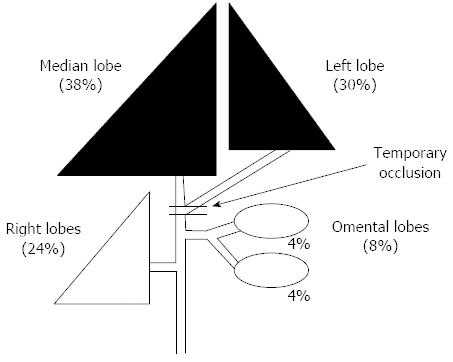
Figure 1 Schematic drawing of the rat model.
The portal vein of the anterior lobe (black area) of the liver was occluded (68%) for various durations, while the arteries remained open.
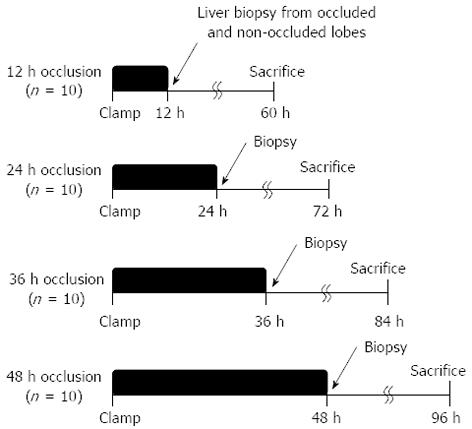
Figure 2 Experimental protocol.
The portal vein of the anterior lobe (median and left liver lobes) of the liver of a male Wistar rat was occluded (70%) for 12, 24, 36 and 48 h. Rats to be sacrificed were prepared at 48 h after each reperfusion (models for each group: n = 10).
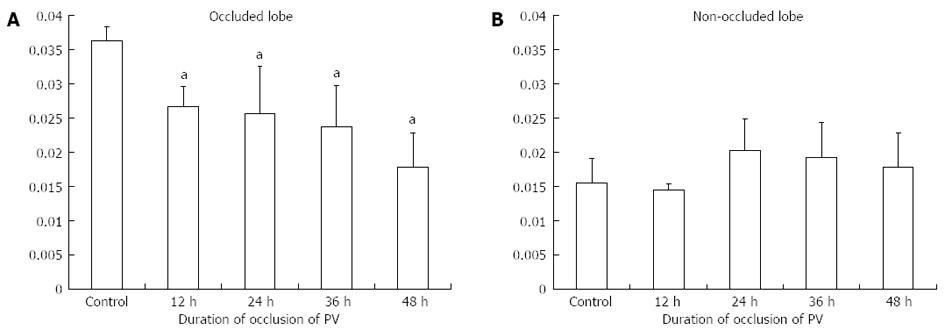
Figure 3 Liver weight/body weight.
A: The liver weight/body weight ratio was decreased by temporary occlusion of the occluded anterior lobes; B: There were no significant differences within each group in non-occluded lobe. aP < 0.05 vs control group.
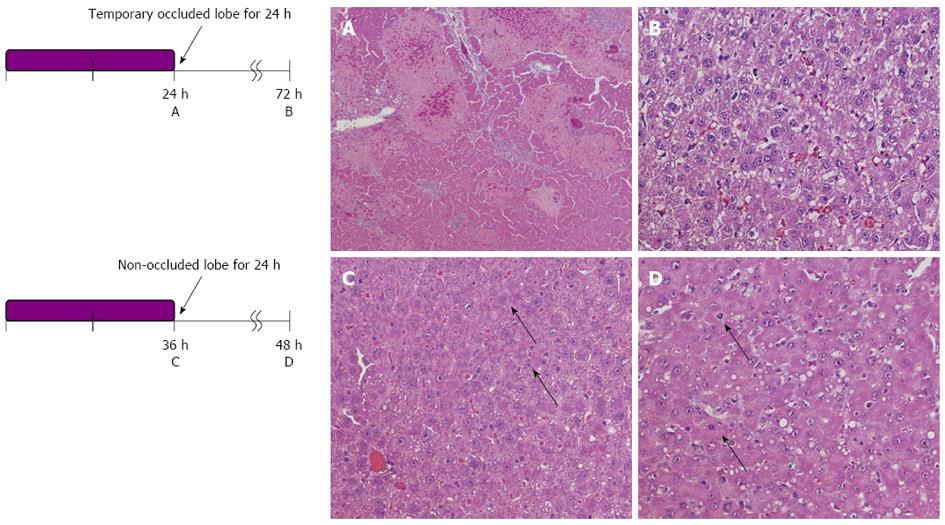
Figure 4 Changes in hepatic histology.
Histology in temporary occluded lobes. A: 24 h occlusion, × 100; B: 36 h occlusion, × 400; C: In non-occluded lobes 24 h occlusion, × 100; D: 48 h occlusion, × 400 is shown by HE staining. In the occluded liver lobe, before reperfusion, coagulative necrosis may be observed around the central vein in proportion to the occlusion time. However, the above-mentioned necrotic area decreased at 48 h after portal vein reperfusion. In the non-occluded liver lobe, hepatocytes became hypertrophic, and some mitoses could be observed (arrows).
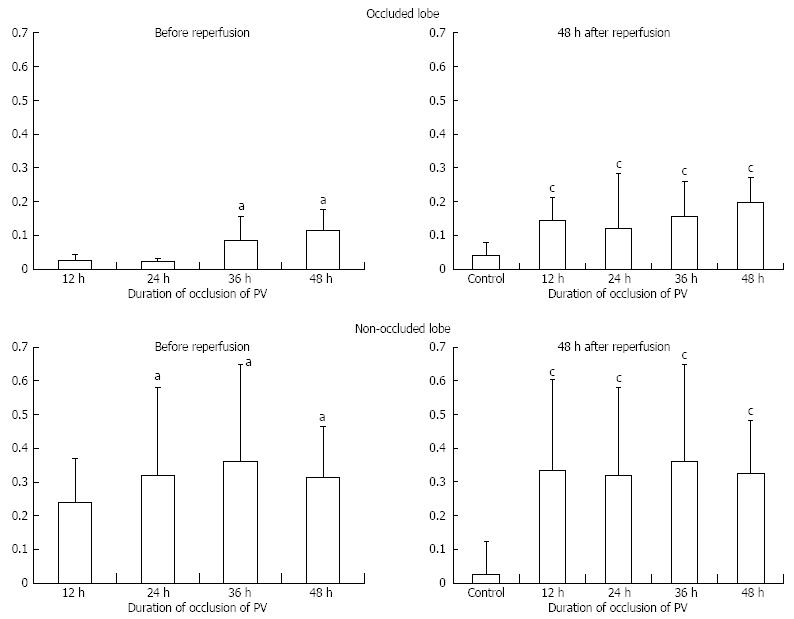
Figure 5 Proliferating-cell nuclear antigen labeling index.
Proliferating-cell nuclear antigen (PCNA) labeling index in each lobe at the time before reperfusion and 48 h after reperfusion. aP < 0.05 vs 12 h group; cP < 0.05 vs 24 h group. PV: Portal vein.
- Citation: Hamasaki K, Eguchi S, Soyama A, Hidaka M, Takatsuki M, Fujita F, Kanetaka K, Minami S, Kuroki T. Chronological changes in the liver after temporary partial portal venous occlusion. World J Gastroenterol 2013; 19(34): 5700-5705
- URL: https://www.wjgnet.com/1007-9327/full/v19/i34/5700.htm
- DOI: https://dx.doi.org/10.3748/wjg.v19.i34.5700


