Copyright
©2013 Baishideng Publishing Group Co.
World J Gastroenterol. Sep 7, 2013; 19(33): 5551-5556
Published online Sep 7, 2013. doi: 10.3748/wjg.v19.i33.5551
Published online Sep 7, 2013. doi: 10.3748/wjg.v19.i33.5551
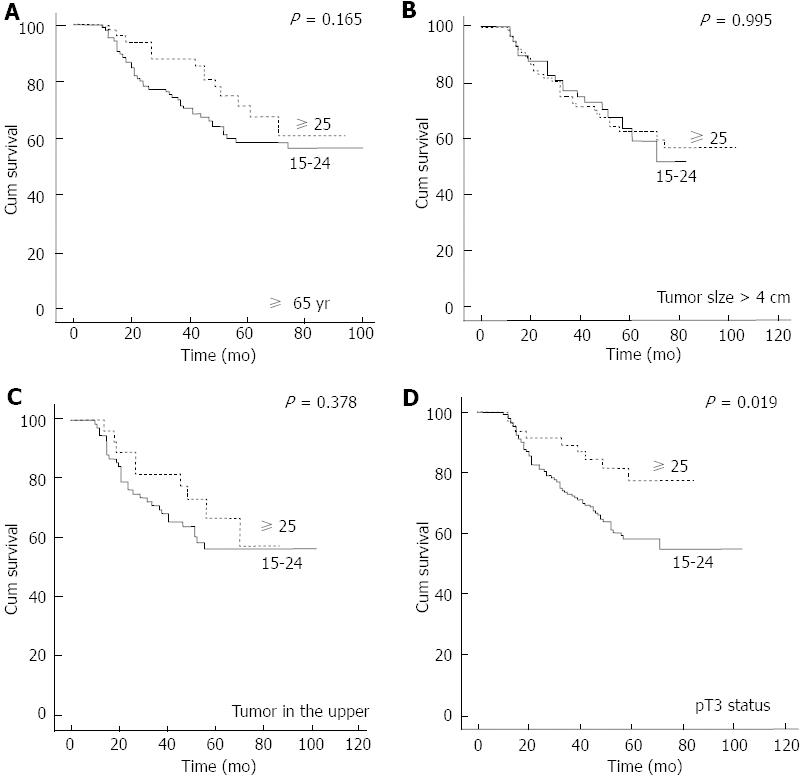
Figure 1 Five-year survival curve for patients with N0 gastric cancer according to the number of resected lymph nodes.
A: In ≥ 65 years group, survival curve for 155 patients with N0 gastric cancer according to the number of resected lymph nodes (15-24 and ≥ 25); B: In tumor size > 4 cm group, survival curve for 145 patients with N0 gastric cancer according to the number of resected lymph nodes (15-24 and ≥ 25); C: In the upper location group, survival curve for 103 patients with N0 gastric cancer according to the number of resected lymph nodes (15-24 and ≥ 25); D: In pT3 group, survival curve for 220 patients with N0 gastric cancer according to the number of resected lymph nodes (15-24 and ≥ 25).
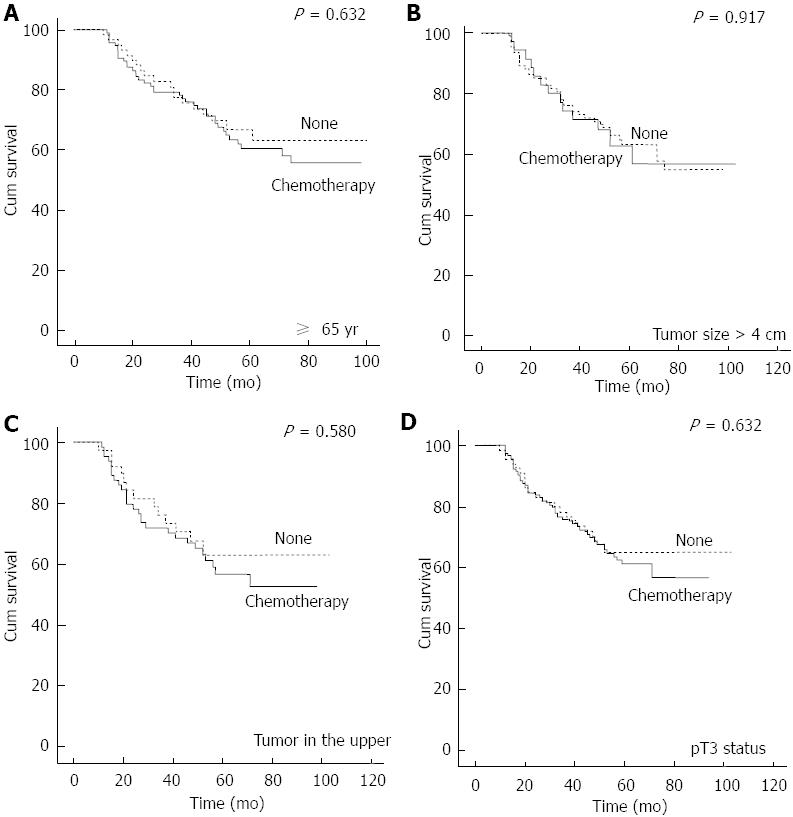
Figure 2 Five-year survival curve for patients with N0 gastric cancer according to whether patients received postoperative chemotherapy.
A: In ≥ 65 years group, survival curve for 155 patients with N0 gastric cancer according to whether patients received postoperative chemotherapy; B: In tumor size > 4 cm group, survival curve for 145 patients with N0 gastric cancer according to whether patients received postoperative chemotherapy; C: In the upper location group, survival curve for 103 patients with N0 gastric cancer according to whether patients received postoperative chemotherapy; D: In pT3 group, survival curve for 220 patients with N0 gastric cancer according to whether patients received postoperative chemotherapy.
- Citation: Xue Q, Wang XN, Deng JY, Zhang RP, Liang H. Effects of extended lymphadenectomy and postoperative chemotherapy on node-negative gastric cancer. World J Gastroenterol 2013; 19(33): 5551-5556
- URL: https://www.wjgnet.com/1007-9327/full/v19/i33/5551.htm
- DOI: https://dx.doi.org/10.3748/wjg.v19.i33.5551


