Copyright
©2013 Baishideng Publishing Group Co.
World J Gastroenterol. Aug 14, 2013; 19(30): 4958-4965
Published online Aug 14, 2013. doi: 10.3748/wjg.v19.i30.4958
Published online Aug 14, 2013. doi: 10.3748/wjg.v19.i30.4958
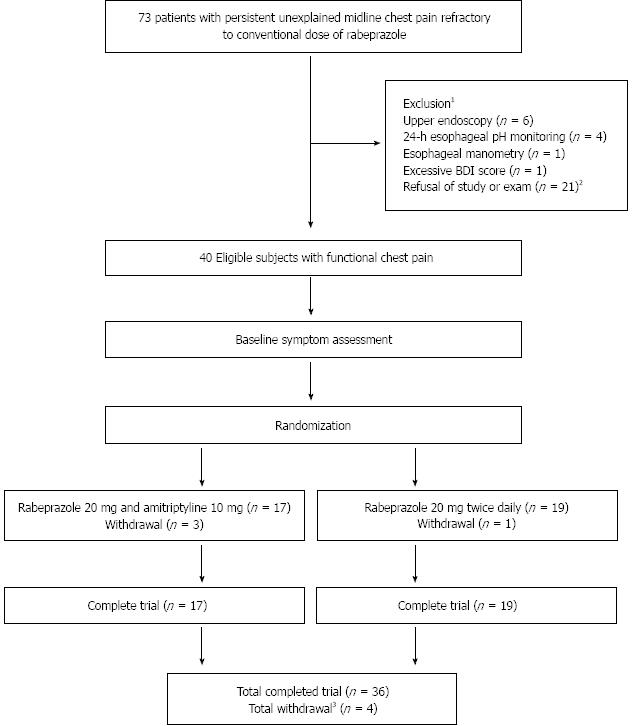
Figure 1 Flow of patients throughout the trial.
1Upper gastrointestinal endoscopy showed erosive gastroesophageal reflux disease (n = 5), and peptic ulcer disease (n = 1). Pathological acid exposure was found in four patients by ambulatory 24 h esophageal pH monitoring. An esophageal motility disorder was found in one patient by esophageal manometric examination. The Beck Depression Index score of one patient exceeded 19 points; 2Sixteen patients refused to take part in this study, and five patients refused examination by esophageal manometry or ambulatory 24 h esophageal pH monitoring; 3Out of 4 patients, three in group A withdrew because of an amitriptyline-associated adverse event. One patient in group B dropped out of the trial because of loss to follow-up. BDI: Beck Depression Inventory.
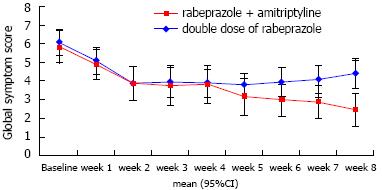
Figure 2 Efficacy of both treatment groups on the global symptom score.
The global symptom scores over time was associated with each treatment. The overall mean difference between the two groups was not significantly different (P = 0.172). However, we found that the time effect and time × group interaction effect were significant (P < 0.001 and P = 0.006, respectively). Consequently, the between-group difference in global symptom scores was statistically significant at the last week (P < 0.001).
Figure 3 Symptom response rate (A) and Beck Depression Inventory scores (B) after treatment.
A: The response rates in patients after treatment with rabeprazole + amitriptyline vs double-dose of rabeprazole on the per-protocol analysis are demonstrated. In this analysis, the difference of the response rate between both groups was statistically significant; B: The Beck Depression Inventory (BDI) scores after treatment with amitriptyline and rabeprazole vs double-dose of rabeprazole are represented. The overall mean difference of BDI scores after 8 wk of treatment was not significantly different between group A and group B (6.71 ± 1.99 vs 7.16 ± 1.89, respectively; P = 0.49).
- Citation: Park SW, Lee H, Lee HJ, Park JC, Shin SK, Lee SK, Lee YC, Kim JE. Low-dose amitriptyline combined with proton pump inhibitor for functional chest pain. World J Gastroenterol 2013; 19(30): 4958-4965
- URL: https://www.wjgnet.com/1007-9327/full/v19/i30/4958.htm
- DOI: https://dx.doi.org/10.3748/wjg.v19.i30.4958


