Copyright
©2013 Baishideng Publishing Group Co.
World J Gastroenterol. Jul 21, 2013; 19(27): 4380-4385
Published online Jul 21, 2013. doi: 10.3748/wjg.v19.i27.4380
Published online Jul 21, 2013. doi: 10.3748/wjg.v19.i27.4380
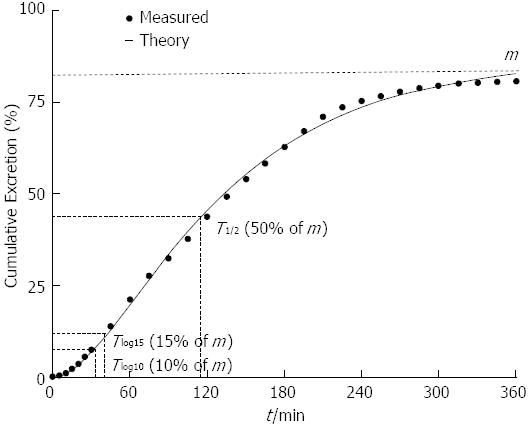
Figure 1 Typical excretion curve of the 13C-octanoic acid breath test in the mouse model.
m: The total cumulative 13C recovery when time is infinite; T1/2: Half gastric emptying time; Tlag10: Lag phase of 10 % emptying; Tlag15: Lag phase for 15% emptying.
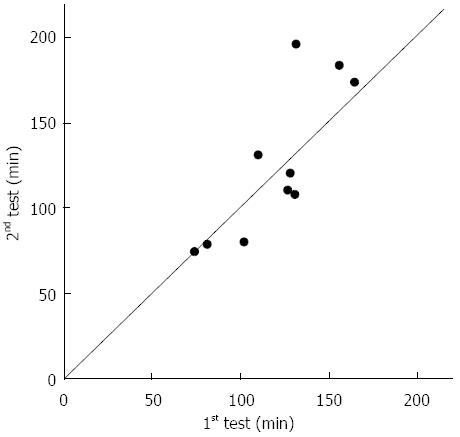
Figure 2 Reproducibility of the 13C-octanoic acid breath test in ten mice.
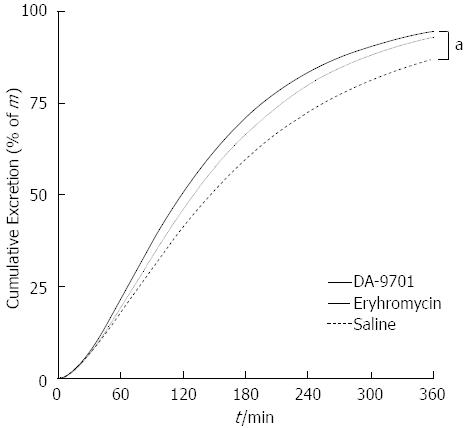
Figure 3 Mean excretion curve of the 13C-octanoic acid breath test in mice treated with DA-9701, erythromycin, and saline.
m: The total cumulative 13C recovery when time is infinite. aP < 0.05 between DA-9701 and saline.
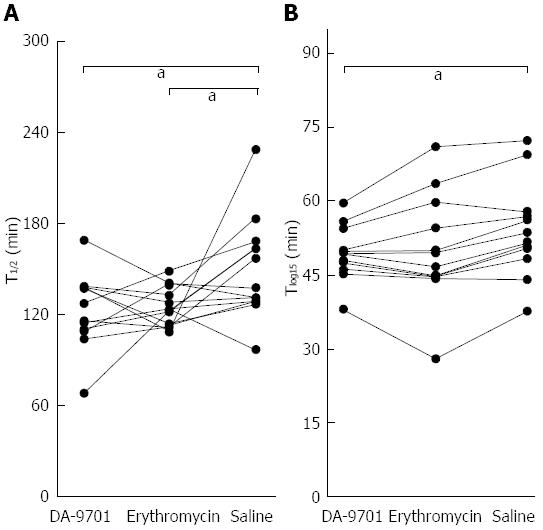
Figure 4 Half gastric emptying time and lag phase for 15% emptying measured by the 13C-octanoic acid breath test in the each mouse treated with DA-9701, erythromycin, and saline.
A: Half gastric emptying time (T1/2); B: Lag phase for 15% emptying (Tlog15). aP < 0.05 vs saline.
- Citation: Lim CH, Choi MG, Park H, Baeg MK, Park JM. Effect of DA-9701 on gastric emptying in a mouse model: Assessment by 13C-octanoic acid breath test. World J Gastroenterol 2013; 19(27): 4380-4385
- URL: https://www.wjgnet.com/1007-9327/full/v19/i27/4380.htm
- DOI: https://dx.doi.org/10.3748/wjg.v19.i27.4380


