Copyright
©2013 Baishideng Publishing Group Co.
World J Gastroenterol. Jun 14, 2013; 19(22): 3439-3446
Published online Jun 14, 2013. doi: 10.3748/wjg.v19.i22.3439
Published online Jun 14, 2013. doi: 10.3748/wjg.v19.i22.3439
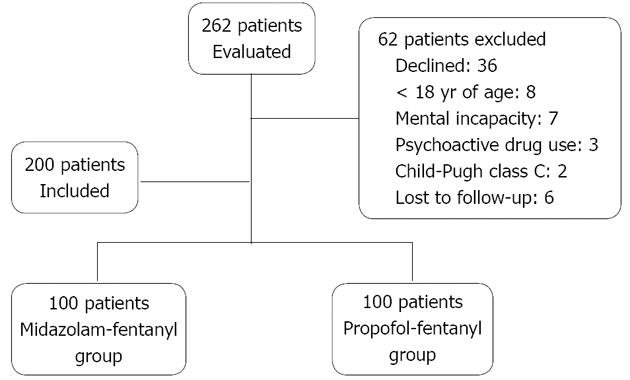
Figure 1 Flowchart of the study design.
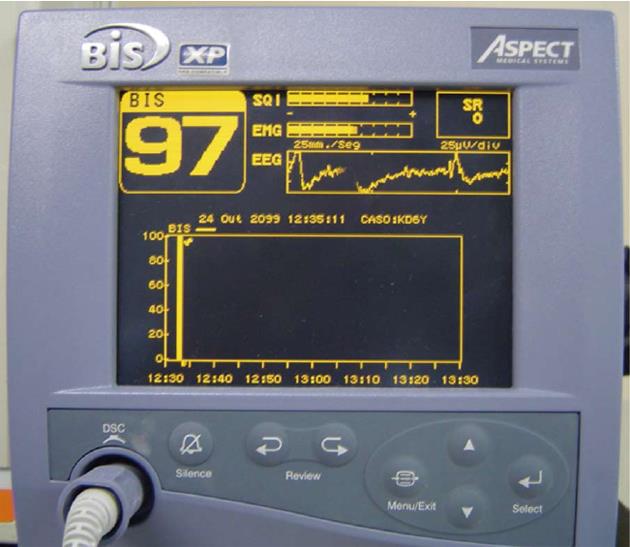
Figure 2 Bispectral index monitor.
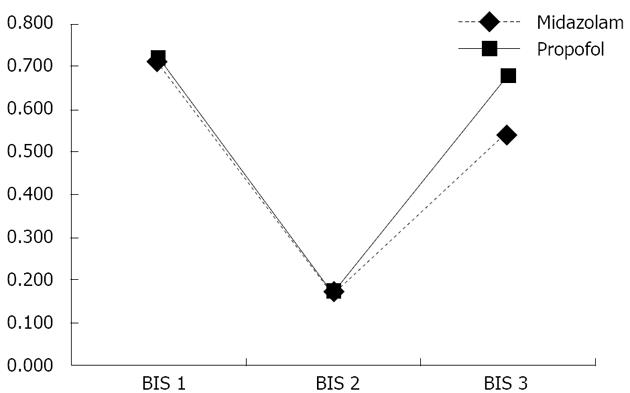
Figure 3 Bispectral values before, during, and after diagnostic upper gastrointestinal endoscopy according to group.
Bispectral (BIS) 1: Before the procedure; BIS 2: During the procedure; BIS 3: After the procedure.
- Citation: Santos MELD, Maluf-Filho F, Chaves DM, Matuguma SE, Ide E, Luz GO, Souza TF, Pessorrusso FCS, Moura EGH, Sakai P. Deep sedation during gastrointestinal endoscopy: Propofol-fentanyl and midazolam-fentanyl regimens. World J Gastroenterol 2013; 19(22): 3439-3446
- URL: https://www.wjgnet.com/1007-9327/full/v19/i22/3439.htm
- DOI: https://dx.doi.org/10.3748/wjg.v19.i22.3439


