Copyright
©2013 Baishideng Publishing Group Co.
World J Gastroenterol. Jan 14, 2013; 19(2): 274-283
Published online Jan 14, 2013. doi: 10.3748/wjg.v19.i2.274
Published online Jan 14, 2013. doi: 10.3748/wjg.v19.i2.274
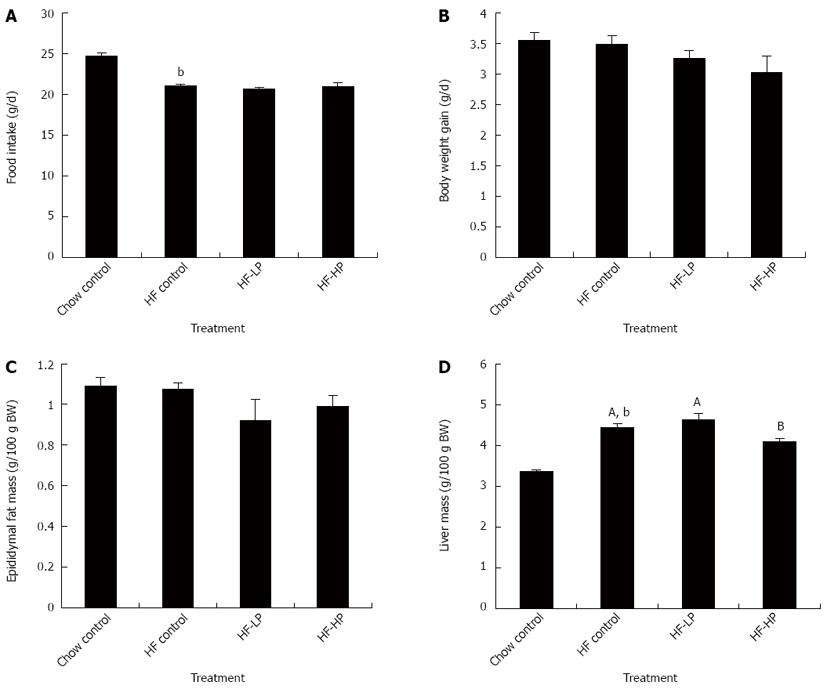
Figure 1 Effects of probiotic treatment on food intake (A), body weight gain (B), epididymal fat mass (C) and liver mass (D) in high-fructose diet-fed rats.
Results are expressed as mean ± SE. bP < 0.01 vs chow control by unpaired Student’s t-test; ABBars with different capital letters are significantly different at P < 0.05 by Duncan’s multiple range tests. HP: High dose probiotic; HF: High fructose diet; LP: Low dose probiotic; BW: Body weight.
Figure 2 Effects of probiotic treatment on plasma triglyceride (A), plasma total cholesterol (B) and plasma high-density lipoprotein cholesterol (C) in high-fructose diet-fed rats.
Results are expressed as mean ± SE. aP < 0.05 and bP < 0.01 vs chow control by unpaired Student’s t-test; ABBars with different capital letters are significantly different at P < 0.05 by Duncan’s multiple range tests. HF: High fructose diet; HP: High dose probiotic; LP: Low dose probiotic; HDL: High-density lipoprotein.
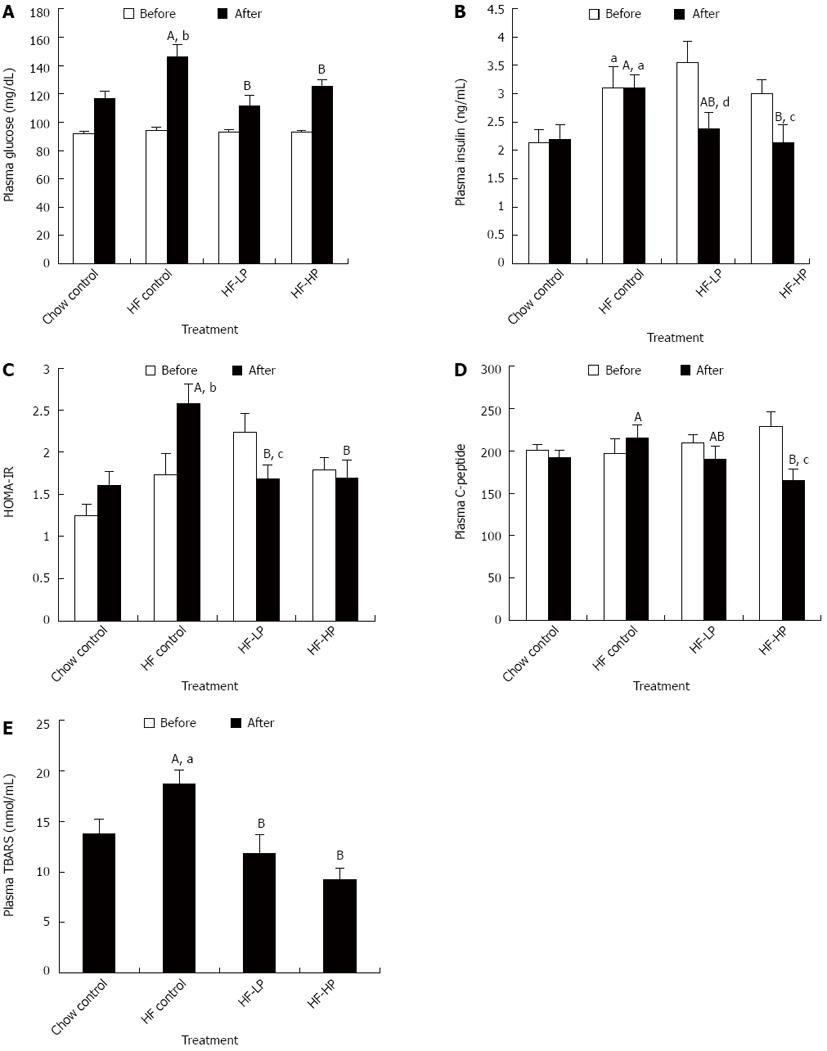
Figure 3 Effects of probiotic treatment on plasma glucose, plasma insulin, insulin resistance, plasma C-peptide and plasma thiobarbituric acid-reacting substances in high-fructose diet-fed rats.
Results are expressed as mean ± SE. aP < 0.05 and bP < 0.01 HF control vs chow control by unpaired Student’s t-test; cP < 0.05 and dP < 0.01 week 6 vs week 3 by paired Student’s t-test; ABBars with different capital letters are significantly different at P < 0.05 by Duncan’s multiple range tests. HF: High fructose diet; LP: Low dose probiotic; HP: High dose probiotic; TBARS: Thiobarbituric acid-reacting substances.
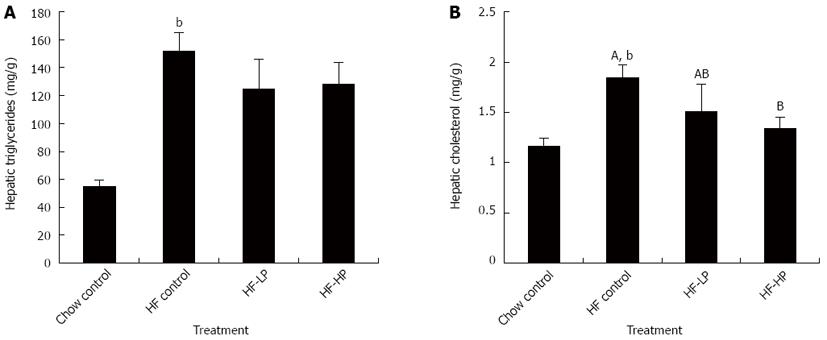
Figure 4 Effects of probiotic treatment on hepatic triglyceride and hepatic total cholesterol in high-fructose diet-fed rats.
Results are expressed as mean ± SE. bP < 0.01 HF control vs chow control by unpaired Student’s t-test; ABBars with different capital letters are significantly different at P < 0.05 by Duncan’s multiple range tests. HF: High fructose diet; LP: Low dose probiotic; HP: High dose probiotic.
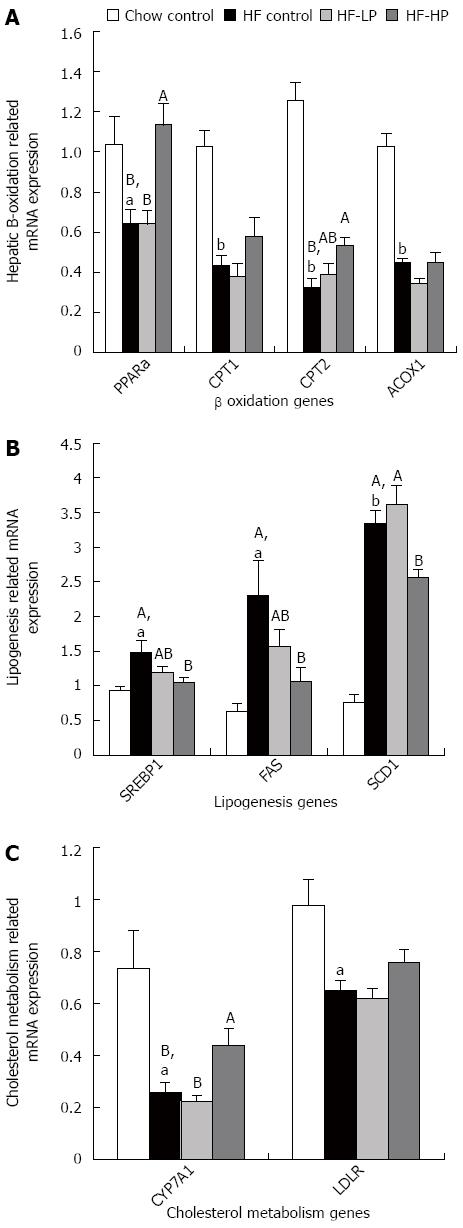
Figure 5 Effects of probiotic treatment on hepatic B-oxidation, lipogenesis and cholesterol metabolism related gene expression in high-fructose diet-fed rats.
Results are expressed as mean ± SE. aP < 0.05 and bP < 0.01 HF control vs chow control by unpaired Student’s t-test; ABBars with different capital letters are significantly different at P < 0.05 by Duncan’s multiple range tests. HF: High fructose diet; LP: Low dose probiotic; HP: High dose probiotic; FAS: Fatty acid synthase; SREBP1: Sterol regulatory element-binding protein-1; PPARα: Peroxisome proliferator-activated receptor α; CPT: Carnitine palmitoyltransferase; ACOX: Acyl-coenzyme A oxidase; SCD: Steaoryl-CoA desaturase; CYP7A1: Cholesterol 7α-hydroxylase gene; LDLR: Low-density lipoprotein receptor.
- Citation: Park DY, Ahn YT, Huh CS, McGregor RA, Choi MS. Dual probiotic strains suppress high fructose-induced metabolic syndrome. World J Gastroenterol 2013; 19(2): 274-283
- URL: https://www.wjgnet.com/1007-9327/full/v19/i2/274.htm
- DOI: https://dx.doi.org/10.3748/wjg.v19.i2.274


