Copyright
©2013 Baishideng Publishing Group Co.
World J Gastroenterol. Apr 28, 2013; 19(16): 2560-2568
Published online Apr 28, 2013. doi: 10.3748/wjg.v19.i16.2560
Published online Apr 28, 2013. doi: 10.3748/wjg.v19.i16.2560
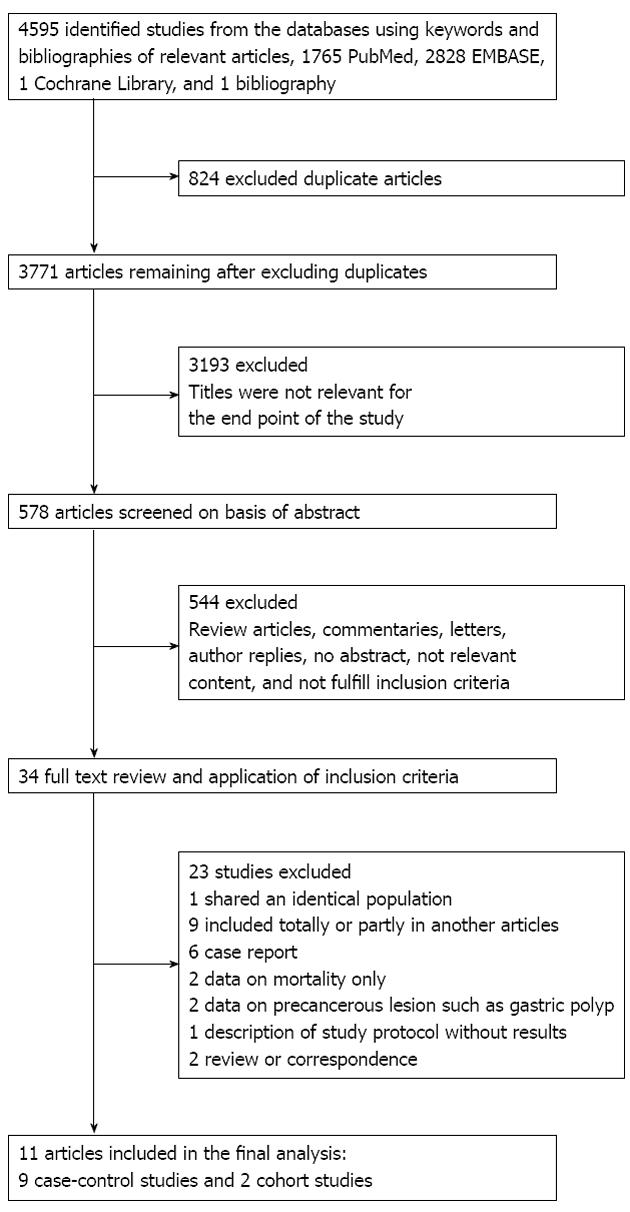
Figure 1 Flow diagram for identification of relevant studies.
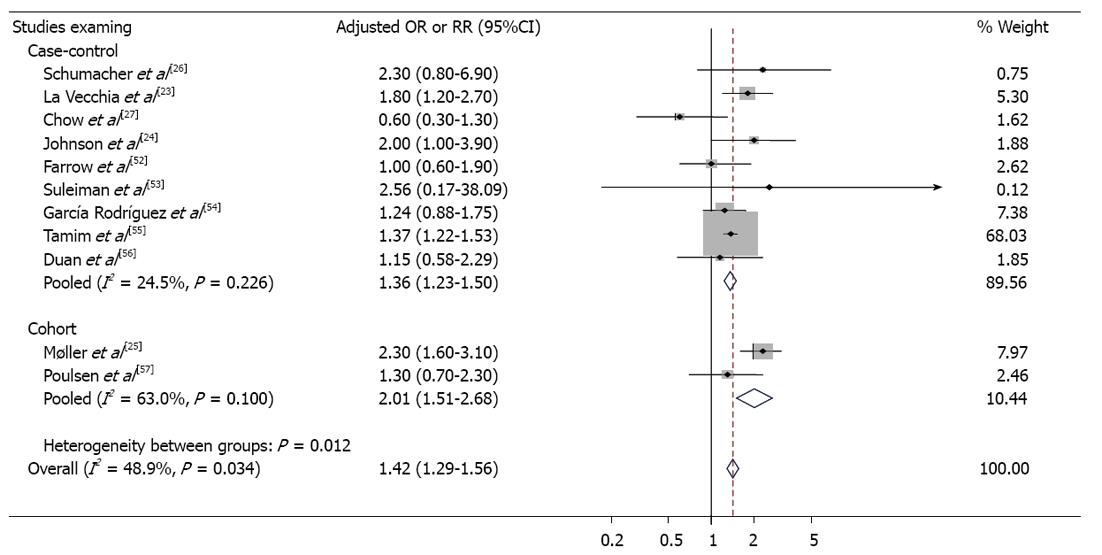
Figure 2 Meta-analysis results of individual and pooled adjusted odds ratio or relative risk of gastric cancer.
The size of each square is proportional to the study’s weight. Diamonds are the summary estimate from the pooled studies with 95%CI. OR: Odds ratio; RR: Relative risk.
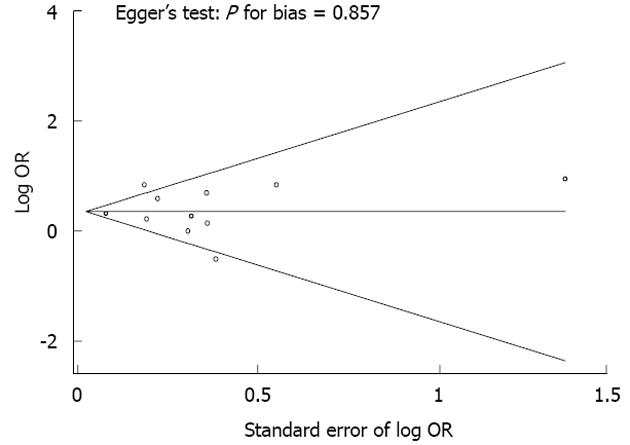
Figure 3 Begg’s funnel plots and Egger’s test for identifying publication bias (P = 0.
857) in a meta-analysis of observational studies (n = 11). OR: Odds ratio.
- Citation: Ahn JS, Eom CS, Jeon CY, Park SM. Acid suppressive drugs and gastric cancer: A meta-analysis of observational studies. World J Gastroenterol 2013; 19(16): 2560-2568
- URL: https://www.wjgnet.com/1007-9327/full/v19/i16/2560.htm
- DOI: https://dx.doi.org/10.3748/wjg.v19.i16.2560


