Copyright
©2013 Baishideng Publishing Group Co.
World J Gastroenterol. Apr 28, 2013; 19(16): 2492-2500
Published online Apr 28, 2013. doi: 10.3748/wjg.v19.i16.2492
Published online Apr 28, 2013. doi: 10.3748/wjg.v19.i16.2492
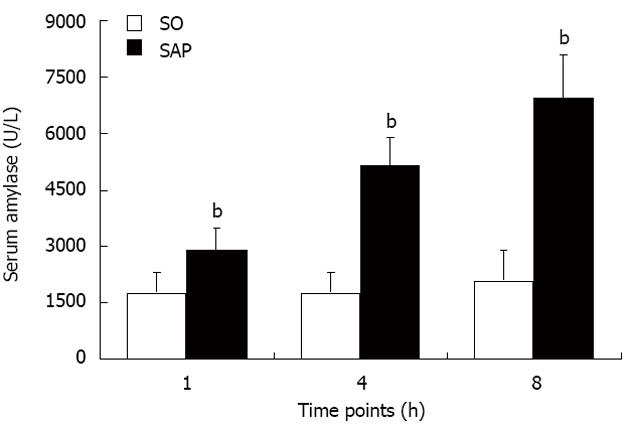
Figure 1 Levels of serum amylase in severe acute pancreatitis and sham-operated rats at each time point.
Each time point (h) after operation consisted of 8 rats. There was no difference among the three time points in the sham operation (SO) group (P > 0.05). The data are expressed as the mean ± SD. bP < 0.01 vs SO group. SAP: Severe acute pancreatitis.
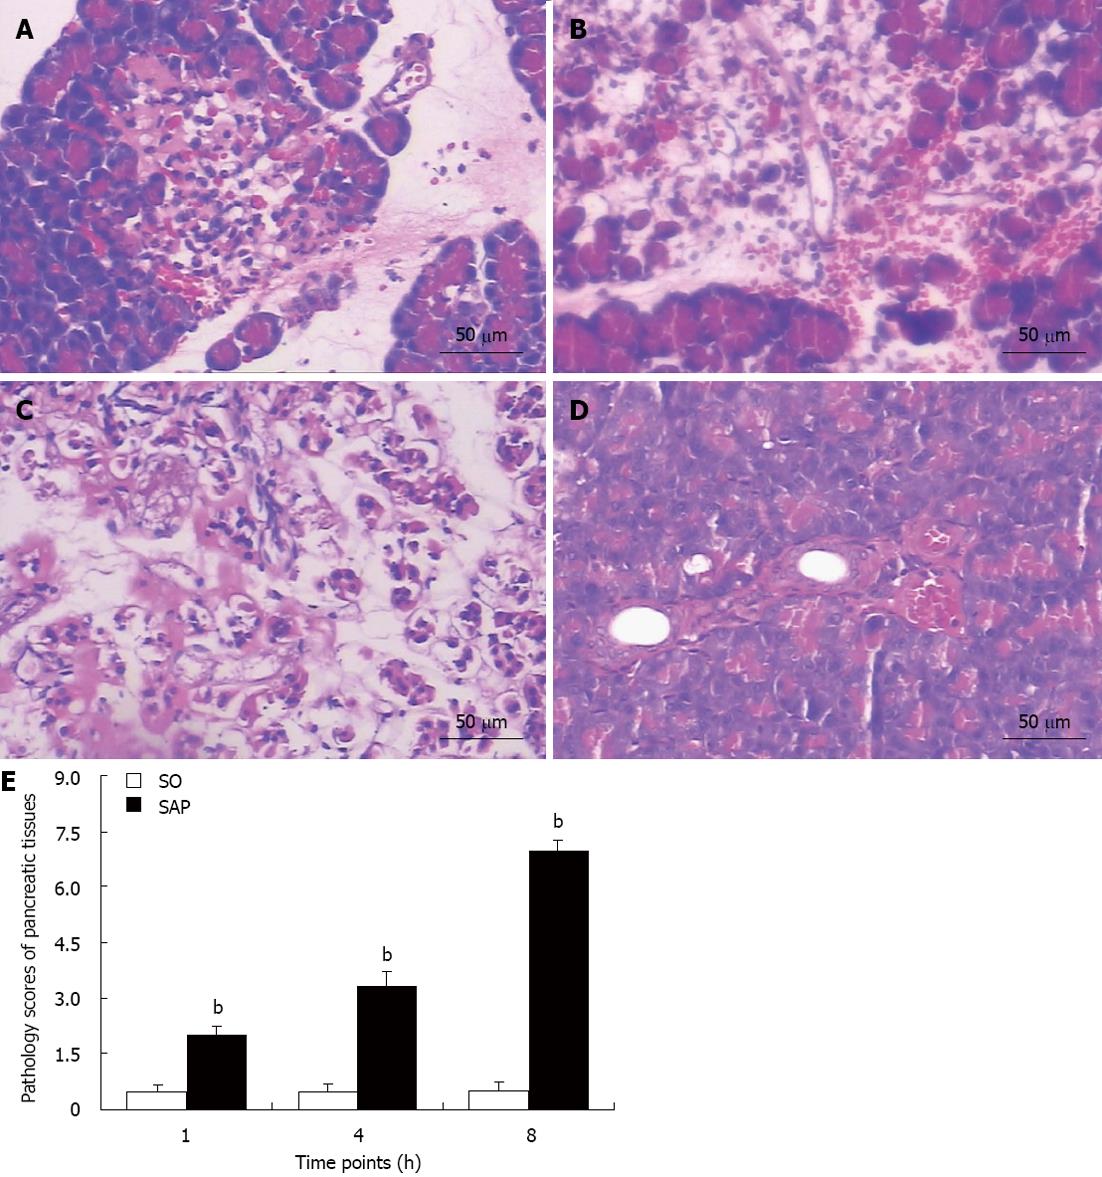
Figure 2 Histology of pancreatic tissues and pathological scores of pancreatic tissues from severe acute pancreatitis and sham-operated rats.
A-C: Histological changes in pancreatic tissues at 1 h (A), 4 h (B), and 8 h (C) in the severe acute pancreatitis (SAP) group; D: Histological changes in pancreatic tissues at 8 h in the sham operation (SO) group (hematoxylin and eosin staining; × 200); E: Pathological scores of pancreatic tissues. Each time point (h) after operation consisted of 8 rats. The data are expressed as the mean ± SD. bP < 0.01 vs SO group.
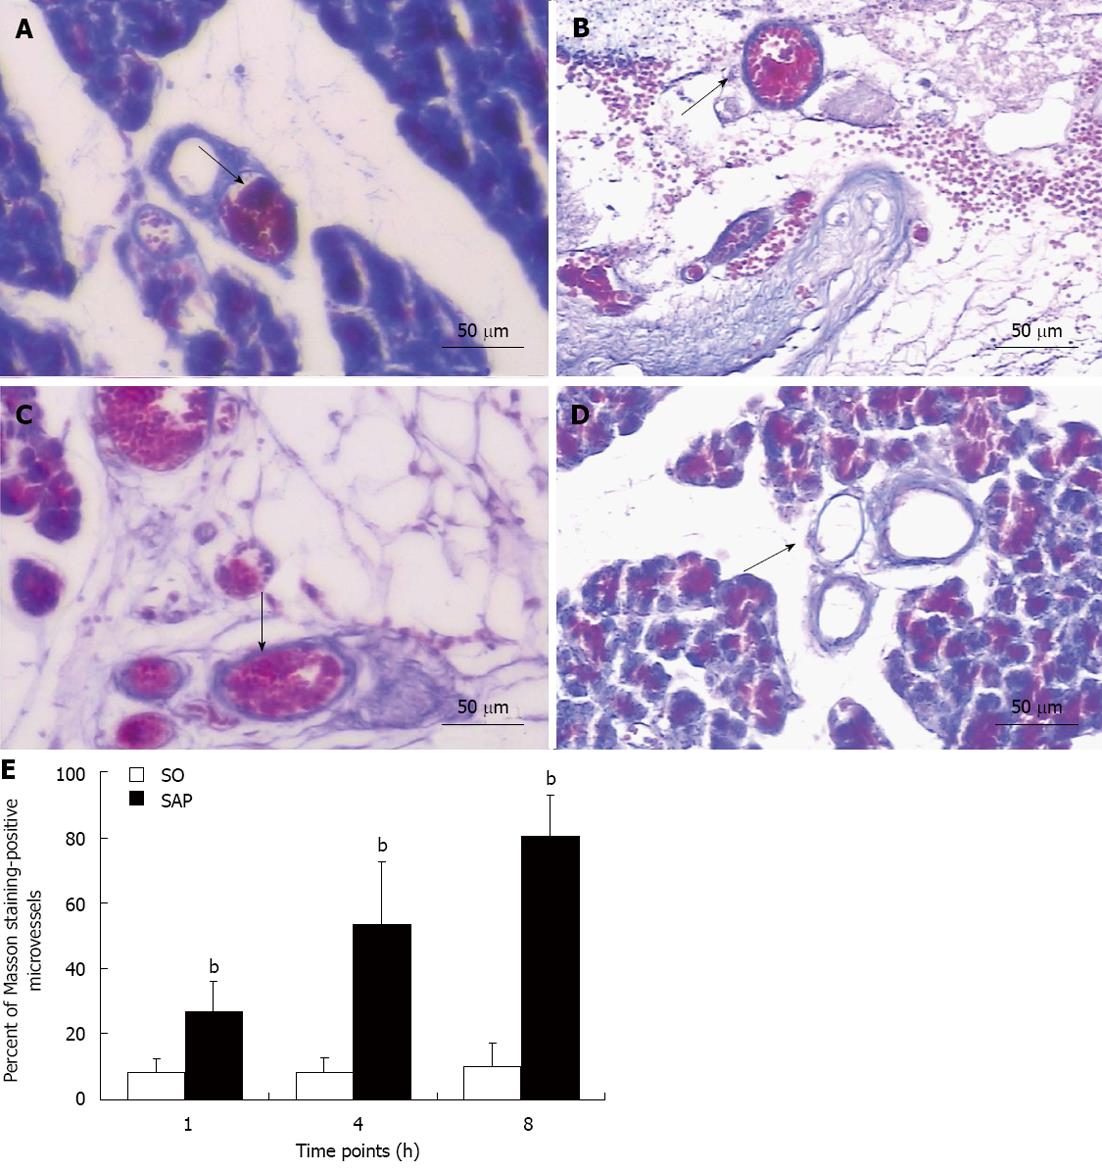
Figure 3 Masson staining of microthrombosis in pancreatic microvessels from severe acute pancreatitis and sham-operated rats (× 200).
A-C: Microthrombosis in situ in pancreatic microvessels of rats with severe acute pancreatitis (SAP) (arrows) at 1 h (A), 4 h (B), and 8 h (C) in the SAP group; D: No microthrombi were detected in the sham operation (SO) group (arrow); E: The percent of Masson staining-positive microvessels. Each time point (h) after operation consisted of 8 rats. The data are expressed as the mean ± SD. bP < 0.01 vs SO group.
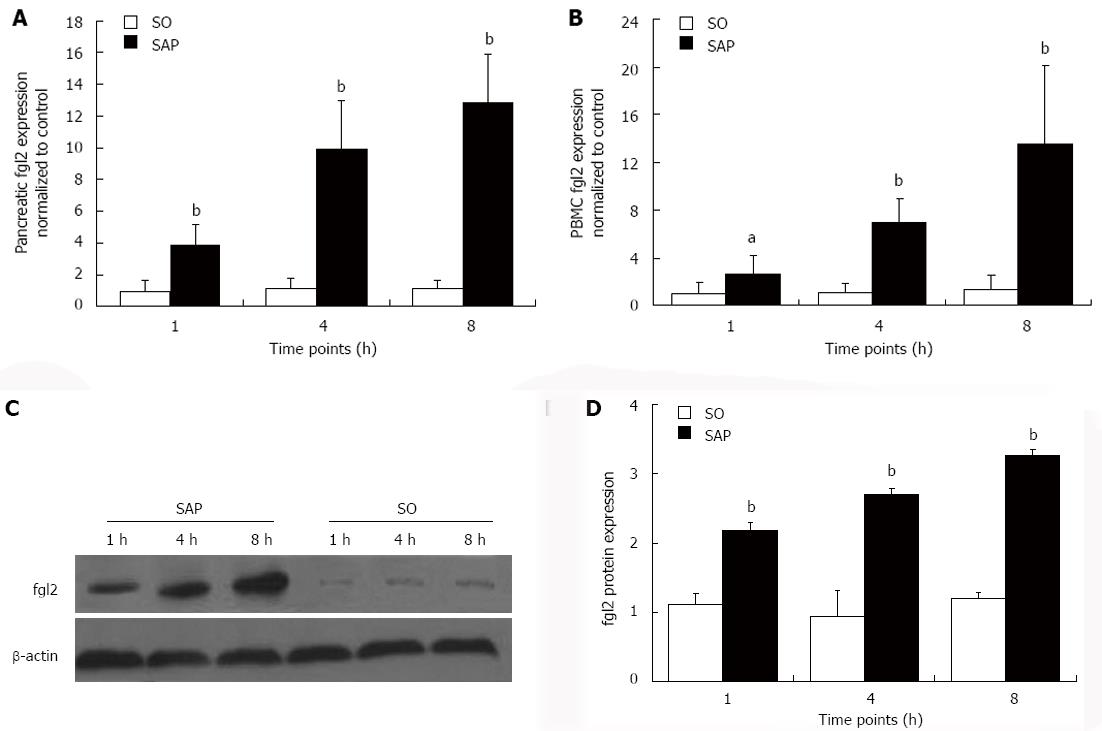
Figure 4 Levels of fibrinogen-like protein 2 mRNA and protein in severe acute pancreatitis and sham-operated rats.
A, B: The calculated levels of fibrinogen-like protein 2 (fgl2) mRNA in the pancreas and peripheral blood mononuclear cells (PBMCs). The expression of fgl2 mRNA is relative to β-actin; C, D: fgl2 protein expression revealed by Western blotting. Protein levels were normalized to β-actin. Each time point (h) after operation consisted of 8 rats. The data are expressed as the mean ± SD. aP < 0.05, bP < 0.01 vs sham operation (SO) group. SAP: Severe acute pancreatitis.
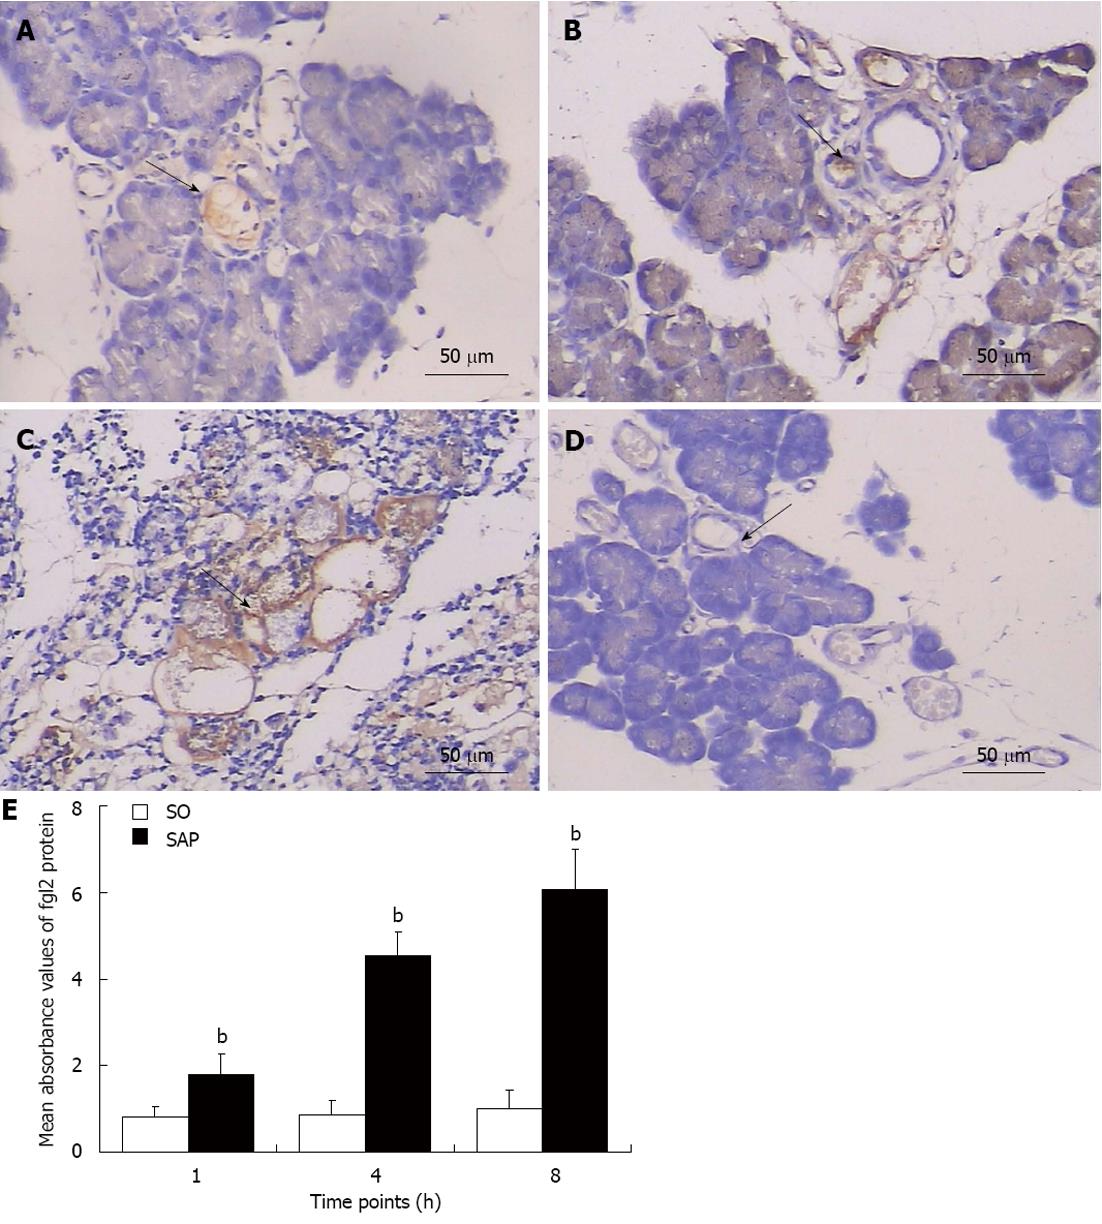
Figure 5 Fibrinogen-like protein 2 expression in pancreatic tissues of severe acute pancreatitis and sham-operated rats with immunohistochemical staining (× 200).
A-D: Fibrinogen-like protein 2 (fgl2) proteins were expressed in microvascular endothelial cells of rats with severe acute pancreatitis (SAP) (arrows in A-C) and control rats (arrow in D) at 1 h (A), 4 h (B), and 8 h (C, D) after initiation of SAP; E: fgl2 protein expression is indicated by the mean absorbance value. The data are expressed as the mean ± SD. bP < 0.01 vs sham operation (SO) group.
- Citation: Ye XH, Chen TZ, Huai JP, Lu GR, Zhuge XJ, Chen RP, Chen WJ, Wang C, Huang ZM. Correlation of fibrinogen-like protein 2 with progression of acute pancreatitis in rats. World J Gastroenterol 2013; 19(16): 2492-2500
- URL: https://www.wjgnet.com/1007-9327/full/v19/i16/2492.htm
- DOI: https://dx.doi.org/10.3748/wjg.v19.i16.2492


