Copyright
©2013 Baishideng Publishing Group Co.
World J Gastroenterol. Apr 28, 2013; 19(16): 2456-2465
Published online Apr 28, 2013. doi: 10.3748/wjg.v19.i16.2456
Published online Apr 28, 2013. doi: 10.3748/wjg.v19.i16.2456
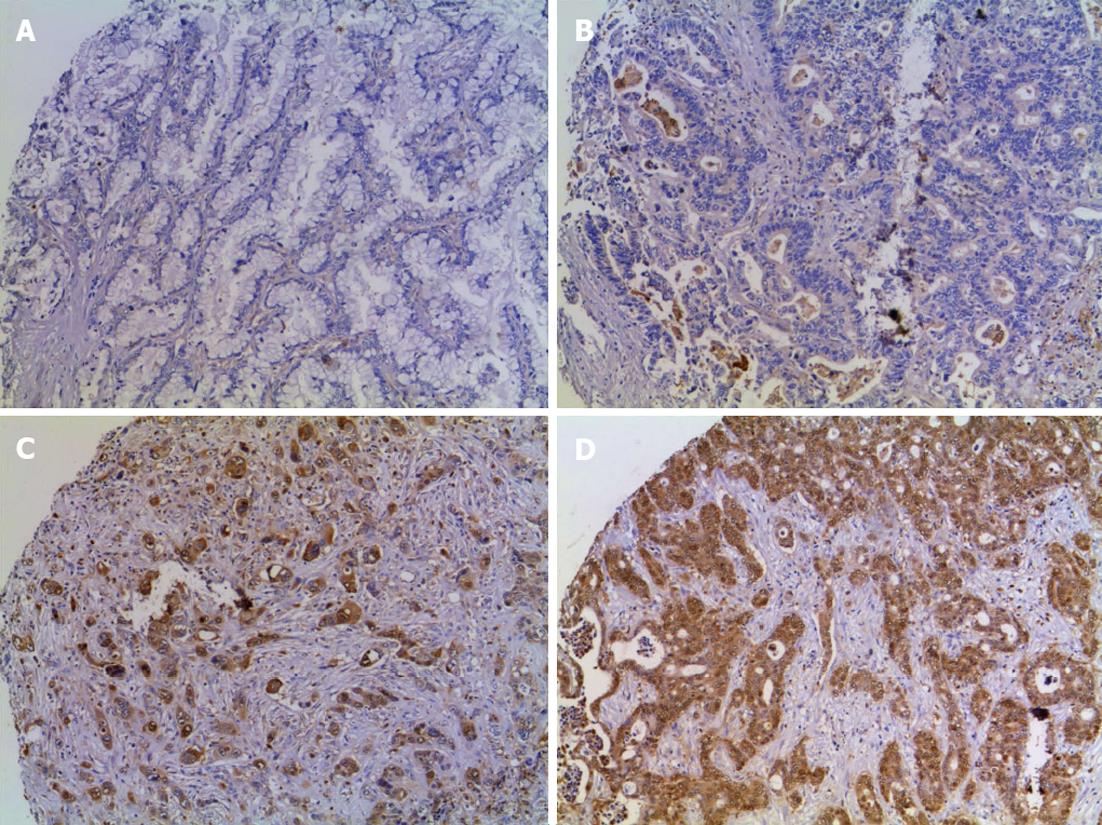
Figure 1 Immunostaining of annexin A1 protein expression in cholangiocarcinoma tissue microarrays.
A-D: Tissue microarray of cholangiocarcinoma samples was stained with anti-annexin A1 antibody and counter stained with Mayer's hematoxylin and represented by A for negative, B for +, C for ++, and D for +++ when expression was < 10%, 10%-25%, 26%-75% and > 75%, respectively (magnification, × 200).
Figure 2 Immunostaining of annexin A1 in hepatocellular carcinoma tissue microarrays.
Tissue microarray of hepatocellular carcinoma (HCC) samples was stained with anti-annexin A1 (ANXA1) antibody and counter stained with Mayer's Hematoxylin. ANXA1 shows low expression in all histologic patterns of HCC. A: Trabecular pattern; B: Broad trabecular pattern; C: Trabecular with pseudoacinar pattern; D: Solid growth pattern (magnification, × 40).
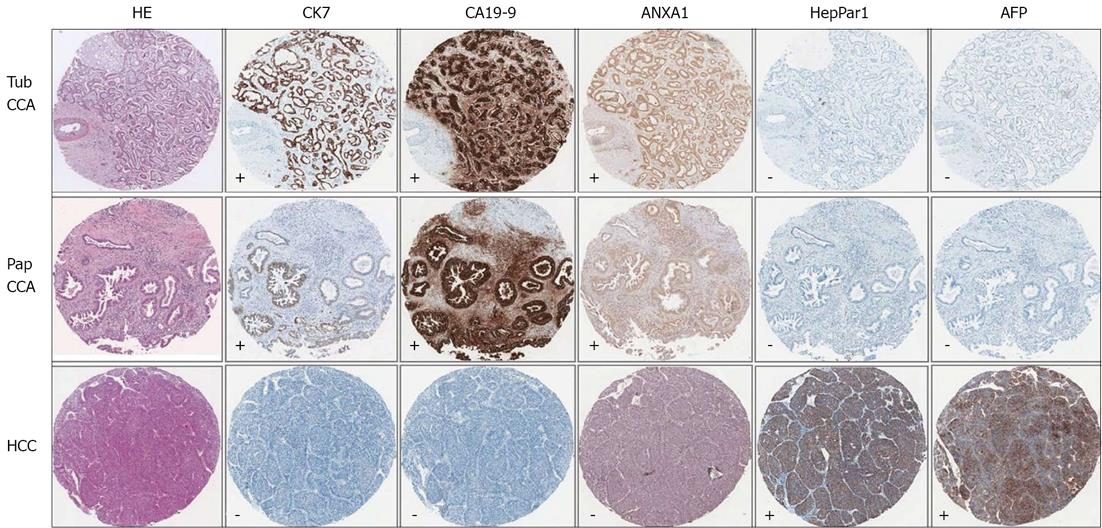
Figure 3 Illustration of the comparative immunohistochemical stains in 3 representative cases.
The 3 representative cases include tubular type cholangiocarcinoma (CCA) (Tub CCA), papillary type CCA (Pap CCA) and hepatocellular carcinoma (HCC). Immunopositivity of cytokeratin 7 (CK7), annexin A1 (ANXA1), hepatocyte paraffin 1 (HepPar1) and alpha-fetoprotein (AFP) appeared as brown cytoplasmic staining of tumor cells, while positivity to carbohydrate antigen 19-9 (CA19-9) appeared as cytoplasmic and luminal staining of tumor (magnification, × 40). Noted that CCA are CK7+/CA19-9+/ANXA1+ and HCC is HepPar1+/AFP+/ANXA1-. -: Negative result; +: Positive result.
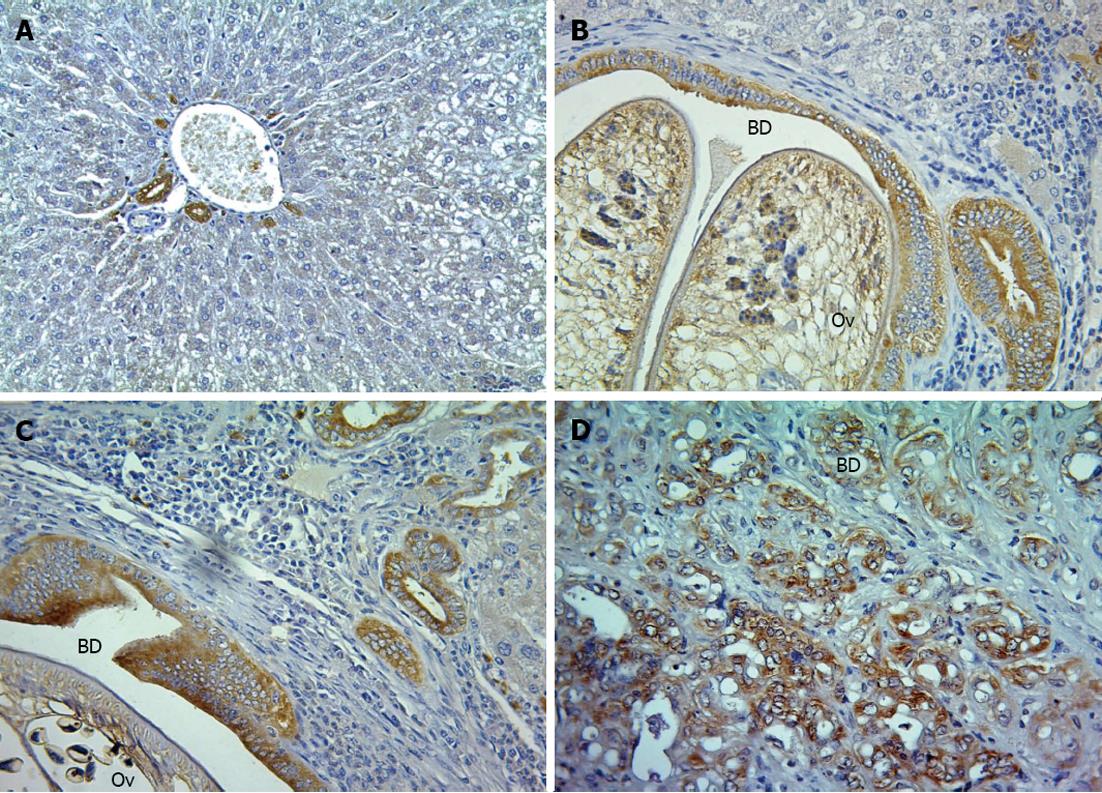
Figure 4 Immunostaining of annexin A1 protein expression in hamster tissues.
A-D: Hamster tissues were stained with anti-annexin A1 antibody and counterstained with Mayer's hematoxylin represented by negative for A (normal at 6 mo post-treatment), grade + for B (21 d post-treatment), grade ++ for C (3 mo post-treatment) and grade +++ for D (6 mo post-treatment) (magnification, × 200). Ov: Opisthorchis viverrini; BD: Bile duct lumen.
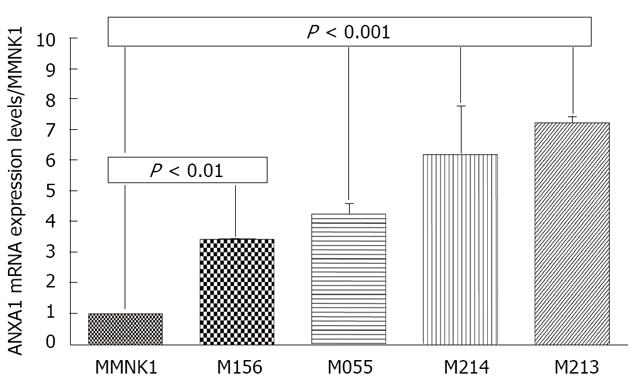
Figure 5 Expression of the annexin A1 gene in various cholangiocarcinoma cell lines.
The mRNA expression level of annexin A1 (ANAX1) was evaluated by real-time reverse transcription-polymerase chain reaction in various cholangiocarcinoma (CCA) cell lines including M156, M055 and M214 moderately differentiated CCA, M213 adenosquamous cell carcinoma and compared to an immortalized human cholangiocyte cell line (MMNK1). Data are derived from duplicate independent experiments and presented as mean ± SD, P < 0.01, P < 0.001 vs MMNK1 is significantly different by the Student t-test.
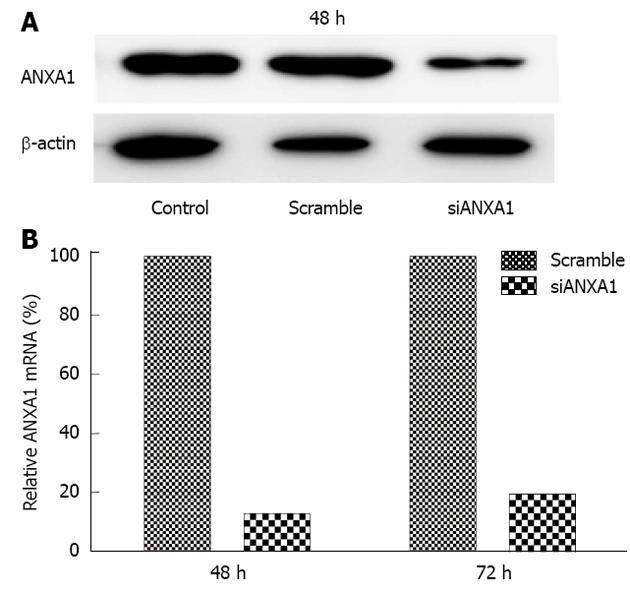
Figure 6 Effect of annexin A1 knockdown on the M214 cholangiocarcinoma cell line.
A, B: Suppression of annexin A1 (ANXA1) expression at the translational level (at 48 h) and transcriptional level (at 48 and 72 h) in knockdown M214 cells was evaluated by Western blotting (A) and real-time reverse transcription-polymerase chain reaction (B).
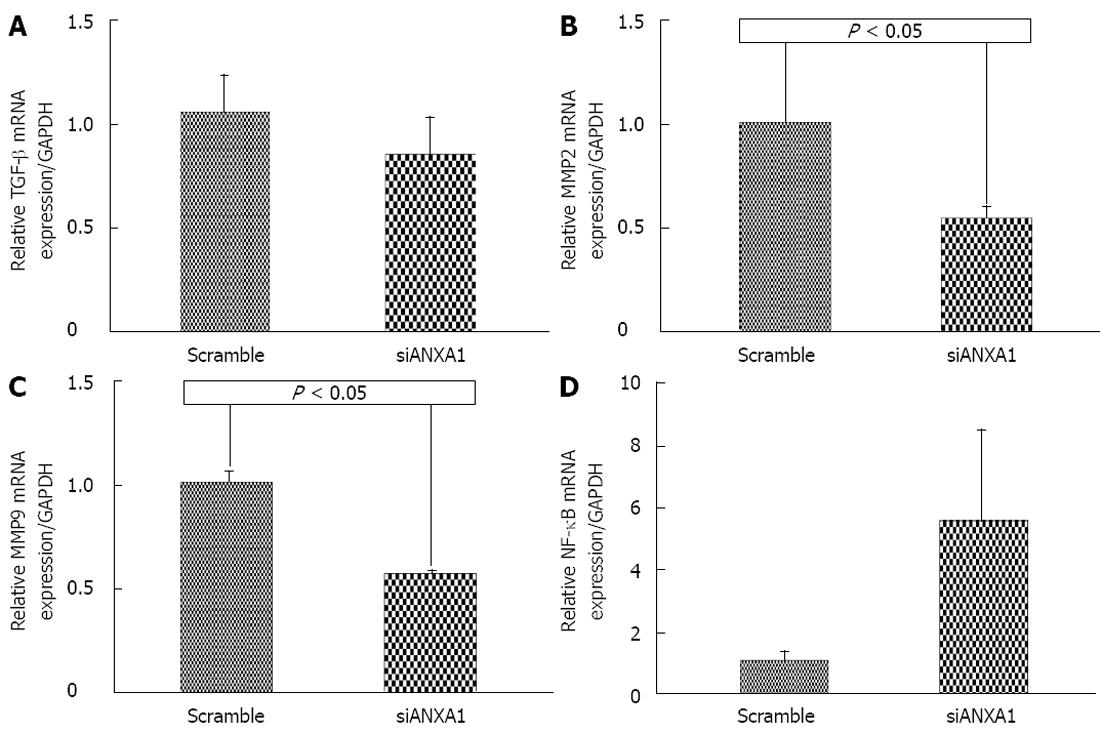
Figure 7 Effect of gene expression in the knockdown of the annexin A1 gene in the M214 cholangiocarcinoma cell line.
A: Relative transforming growth factor-β (TGF-β) mRNA expression; B: Relative matrix metalloproteinase (MMP) 2 mRNA expression; C: Relative MMP9 mRNA expression; D: Relative nuclear factor (NF)-κB mRNA expression. Real-time reverse transcription-polymerase chain reaction was used to confirm the expression of TGF-β, MMP2, MMP9 and NF-κB in the knockdown of the annexin A1 (ANXA1) gene in the M214 cholangiocarcinoma cell line relative to glyceraldehyde-3-phosphate dehydrogenase (GAPDH). Data are derived from duplicate independent experiments and presented as mean ± SD, and P < 0.05 vs scramble is significantly different by the Student t-test.
- Citation: Hongsrichan N, Rucksaken R, Chamgramol Y, Pinlaor P, Techasen A, Yongvanit P, Khuntikeo N, Pairojkul C, Pinlaor S. Annexin A1: A new immunohistological marker of cholangiocarcinoma. World J Gastroenterol 2013; 19(16): 2456-2465
- URL: https://www.wjgnet.com/1007-9327/full/v19/i16/2456.htm
- DOI: https://dx.doi.org/10.3748/wjg.v19.i16.2456


