Copyright
©2013 Baishideng Publishing Group Co.
World J Gastroenterol. Apr 14, 2013; 19(14): 2171-2178
Published online Apr 14, 2013. doi: 10.3748/wjg.v19.i14.2171
Published online Apr 14, 2013. doi: 10.3748/wjg.v19.i14.2171
Figure 1 Fluorescent in-situ hybridization analysis of human epidermal growth factor receptor 2 gene amplification (× 600).
A: Normal human epidermal growth factor receptor 2 (HER2) gene expression: Red signals (HER2 gene), green signals [chromosome enumeration probe 17 (CEP17)], blue signals (nuclei lining dye); B: Positive HER2 gene amplification: HER2:CEP17 > 2; C: Positive HER2 gene amplification: HER2:CEP17 > 2 with clear red cluster signals observed.
Figure 2 Immunohistochemical analysis of human epidermal growth factor receptor 2 protein expression (× 200).
A: Immunohistochemical (IHC) 0: No staining on tumor cell membrane; B: IHC1+: Faintly perceptible staining on > 10% tumor cell membrane; C: IHC2+: Moderate staining on > 10% tumor cell membrane; IHC3+: Strong staining on > 10% tumor cell membrane.
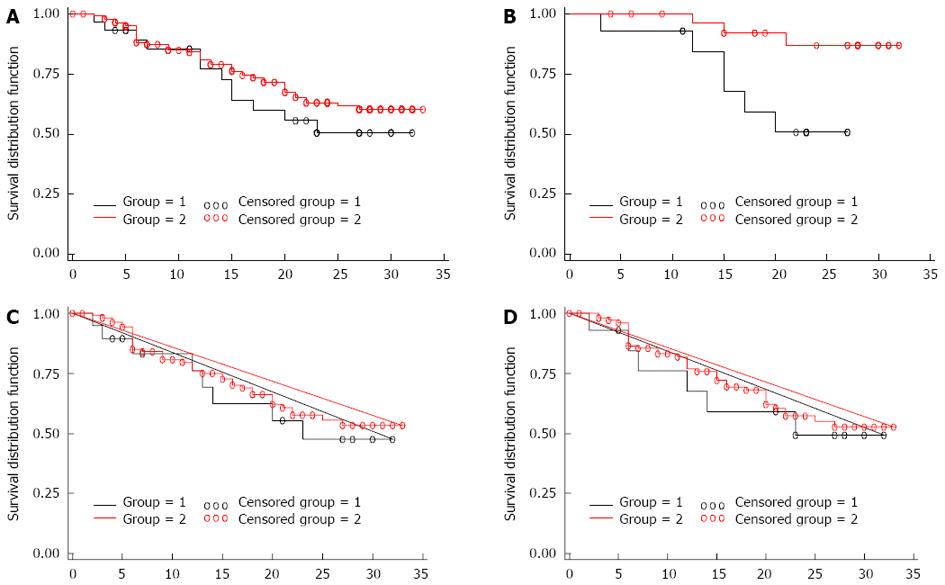
Figure 3 Kaplan-Meier survival analysis.
A: Overall survival curves of 171 gastric cancer patients according to human epidermal growth factor receptor 2 (HER2) detection (P = 0.3386); B: Survival curve of patients with well differentiated gastric cancer according to HER2 expression (P = 0.0123); C: Survival curve of patients with poorly differentiated gastric cancer according to HER2 expression (P = 0.0988); D: Survival curve of patients with the diffuse/mixed type gastric cancer according to HER2 expression (P = 0.6623).
- Citation: He C, Bian XY, Ni XZ, Shen DP, Shen YY, Liu H, Shen ZY, Liu Q. Correlation of human epidermal growth factor receptor 2 expression with clinicopathological characteristics and prognosis in gastric cancer. World J Gastroenterol 2013; 19(14): 2171-2178
- URL: https://www.wjgnet.com/1007-9327/full/v19/i14/2171.htm
- DOI: https://dx.doi.org/10.3748/wjg.v19.i14.2171


