Copyright
©2013 Baishideng Publishing Group Co.
World J Gastroenterol. Mar 28, 2013; 19(12): 1984-1991
Published online Mar 28, 2013. doi: 10.3748/wjg.v19.i12.1984
Published online Mar 28, 2013. doi: 10.3748/wjg.v19.i12.1984
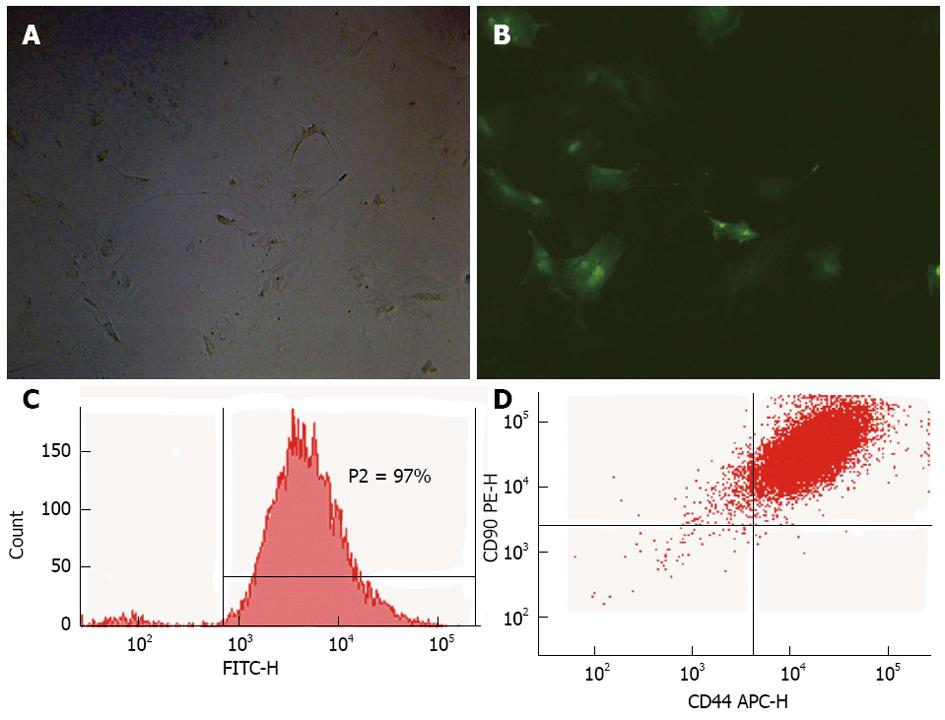
Figure 1 Mesenchymal stem cells transfected with a lentiviral vector carrying the gene encoding green fluorescence protein in vitro.
A: GFP-MSCs cultivated for 3 d and observed by light microscopy (×400); B: GFP-MSCs with green fluorescence (×400); C: Over 97% of GFP-MSCs successfully expressed GFP after propagation; D: Most GFP-MSCs were identified as CD44+ CD90+. GFP: Green fluorescence protein; MSCs: Mesenchymal stem cells; GFP-MSCs: GFP-labeled MSCs.
Figure 2 Changes in inflammatory cytokines (interleukin-1 and tumor necrosis factor α) levels.
Interleukin-1 (IL-1) and tumor necrosis factor α (TNFα) levels in all groups increased after D-galactosamine (D-gal) injection, and then declined slowly. Group D showed a faster reduction in these cytokines following IL-1 receptor antagonist (IL-1Ra) injection than the other groups. aP < 0.05, bP < 0.01 vs control group. MSCs: Mesenchymal stem cells.
Figure 3 Hematoxylin and eosin staining of liver tissues 3 d after surgery.
A: Extensive neutrophil infiltration and lobular architecture collapse was seen in Group A (control group); B: Lobular architecture can be seen in Group B (interleukin-1 receptor antagonist injection group), however, hepatic lobules were filled with cell necrosis and inflammatory cells; C: The lobular architecture in Group C (mesenchymal stem cells transplantation group) was destroyed but can still be recognized; D: Group D had clear hepatic lobular architecture and slight inflammatory cell infiltration. Magnification, ×200.
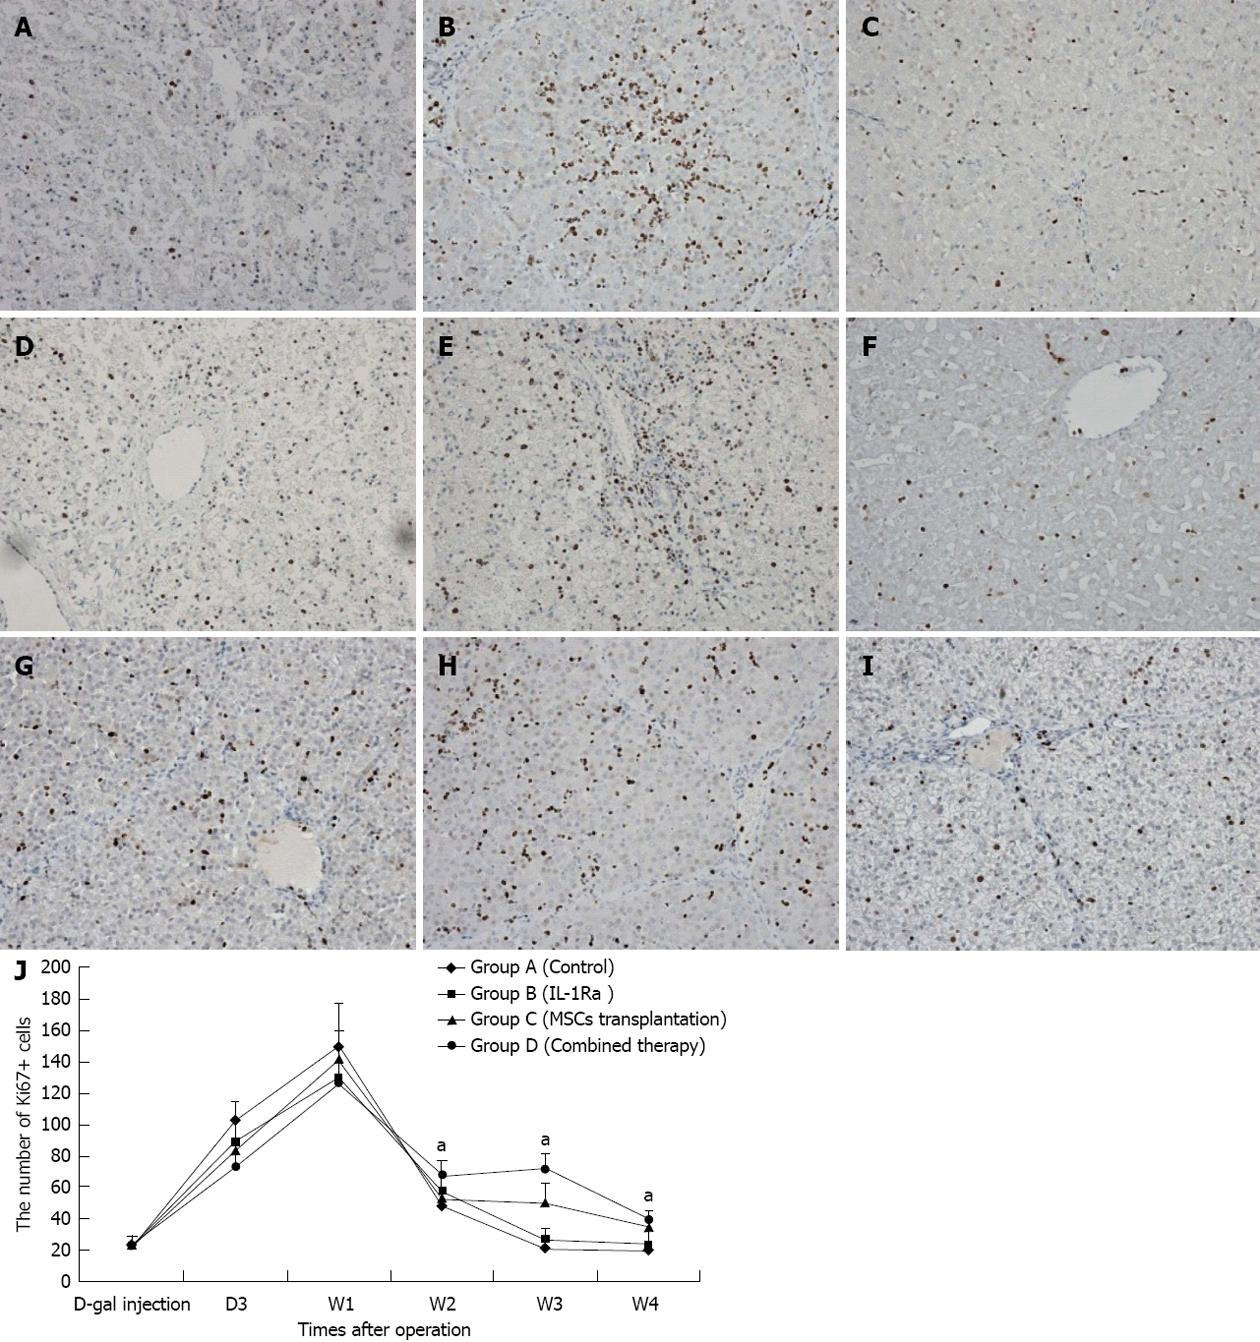
Figure 4 Changes in liver cell proliferation in all four groups.
A, B and C showed the anti-Ki67 stain of Group A at the time point of D3, W1 and W4, respectively (×200); D, E, F and G, H, I showed anti-Ki67 stain of Group B and Group C, respectively, just as Group A did (×200); J: Changes in the number of Ki67+ cells demonstrated that Group D had better long-term proliferation. aP < 0.05 vs control group. IL-1Ra: Interleukin-1 receptor antagonist; MSCs: Mesenchymal stem cells; D-gal: D-galactosamine.
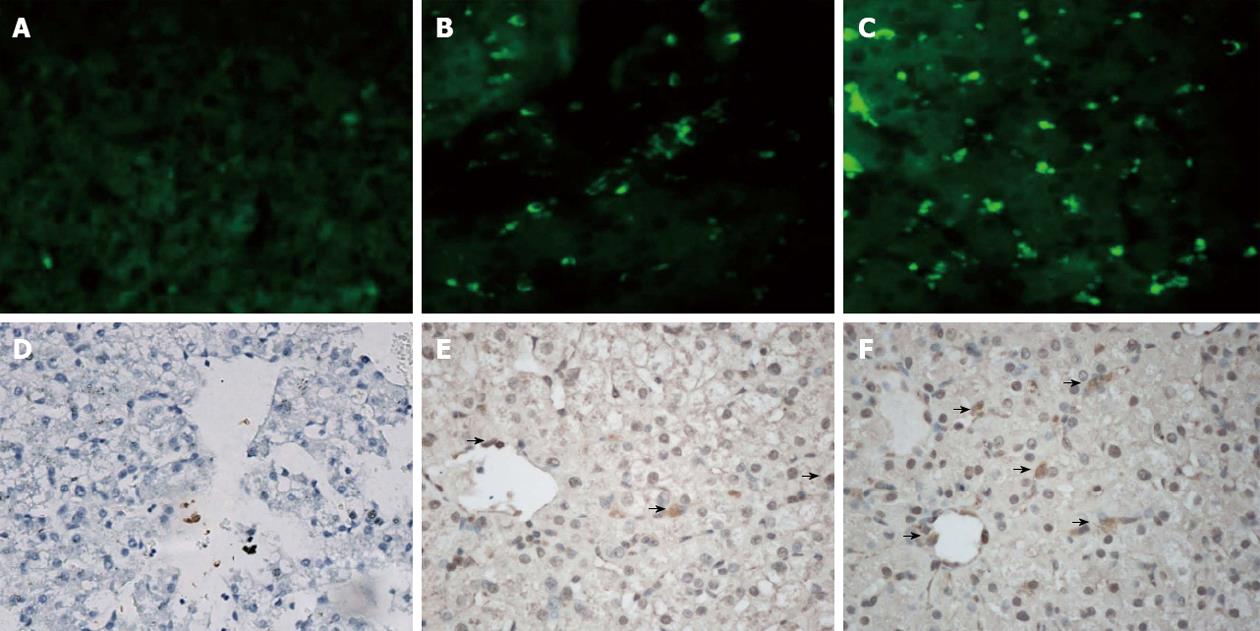
Figure 5 Fluorescence and anti-green fluorescence protein stained images of liver tissue 2 wk after surgery.
A, B and C are fluorescence images of Group B, Group C and Group D, respectively; D, E and F are anti-green fluorescence protein immunohistochemical images of Group B, Group C and Group D, respectively. More cells expressing green fluorescence protein were seen in Group D (arrow). Magnification, ×400.
- Citation: Shi XL, Zhu W, Tan JJ, Xiao JQ, Zhang L, Xu Q, Ma ZL, Ding YT. Effect evaluation of interleukin-1 receptor antagonist nanoparticles for mesenchymal stem cell transplantation. World J Gastroenterol 2013; 19(12): 1984-1991
- URL: https://www.wjgnet.com/1007-9327/full/v19/i12/1984.htm
- DOI: https://dx.doi.org/10.3748/wjg.v19.i12.1984


