Copyright
©2013 Baishideng Publishing Group Co.
World J Gastroenterol. Mar 28, 2013; 19(12): 1975-1983
Published online Mar 28, 2013. doi: 10.3748/wjg.v19.i12.1975
Published online Mar 28, 2013. doi: 10.3748/wjg.v19.i12.1975
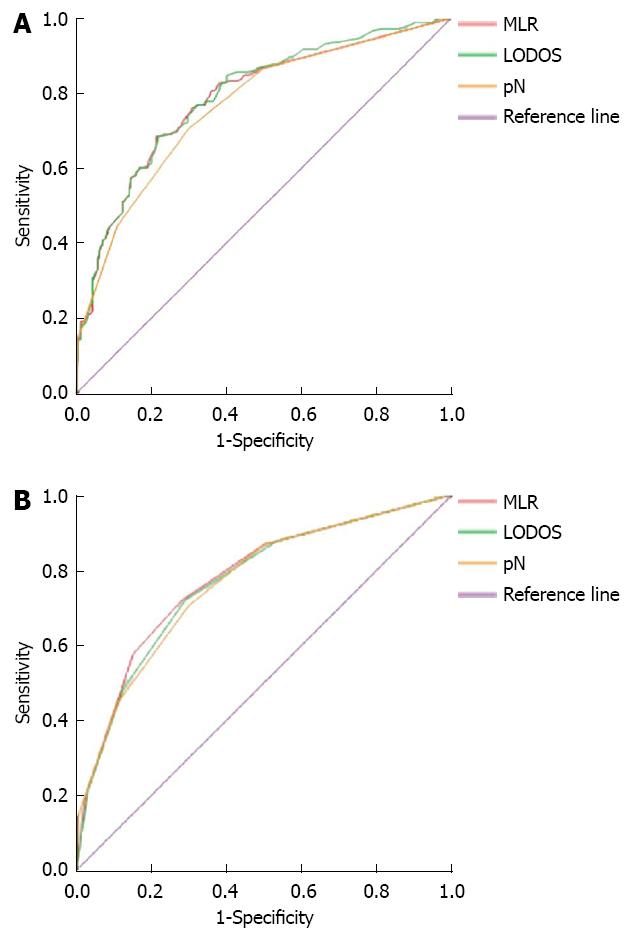
Figure 1 Comparison of receiver operating characteristic curves with metastatic lymph node ratio, log odds of positive lymph nodes, and positive lymph nodes staging methods.
A: Receiver operating characteristic (ROC) curves with no staging; B: ROC curves with staging. MLR: Metastatic lymph node ratio; LODDS: Log odds of positive lymph nodes; pN: Positive lymph nodes.
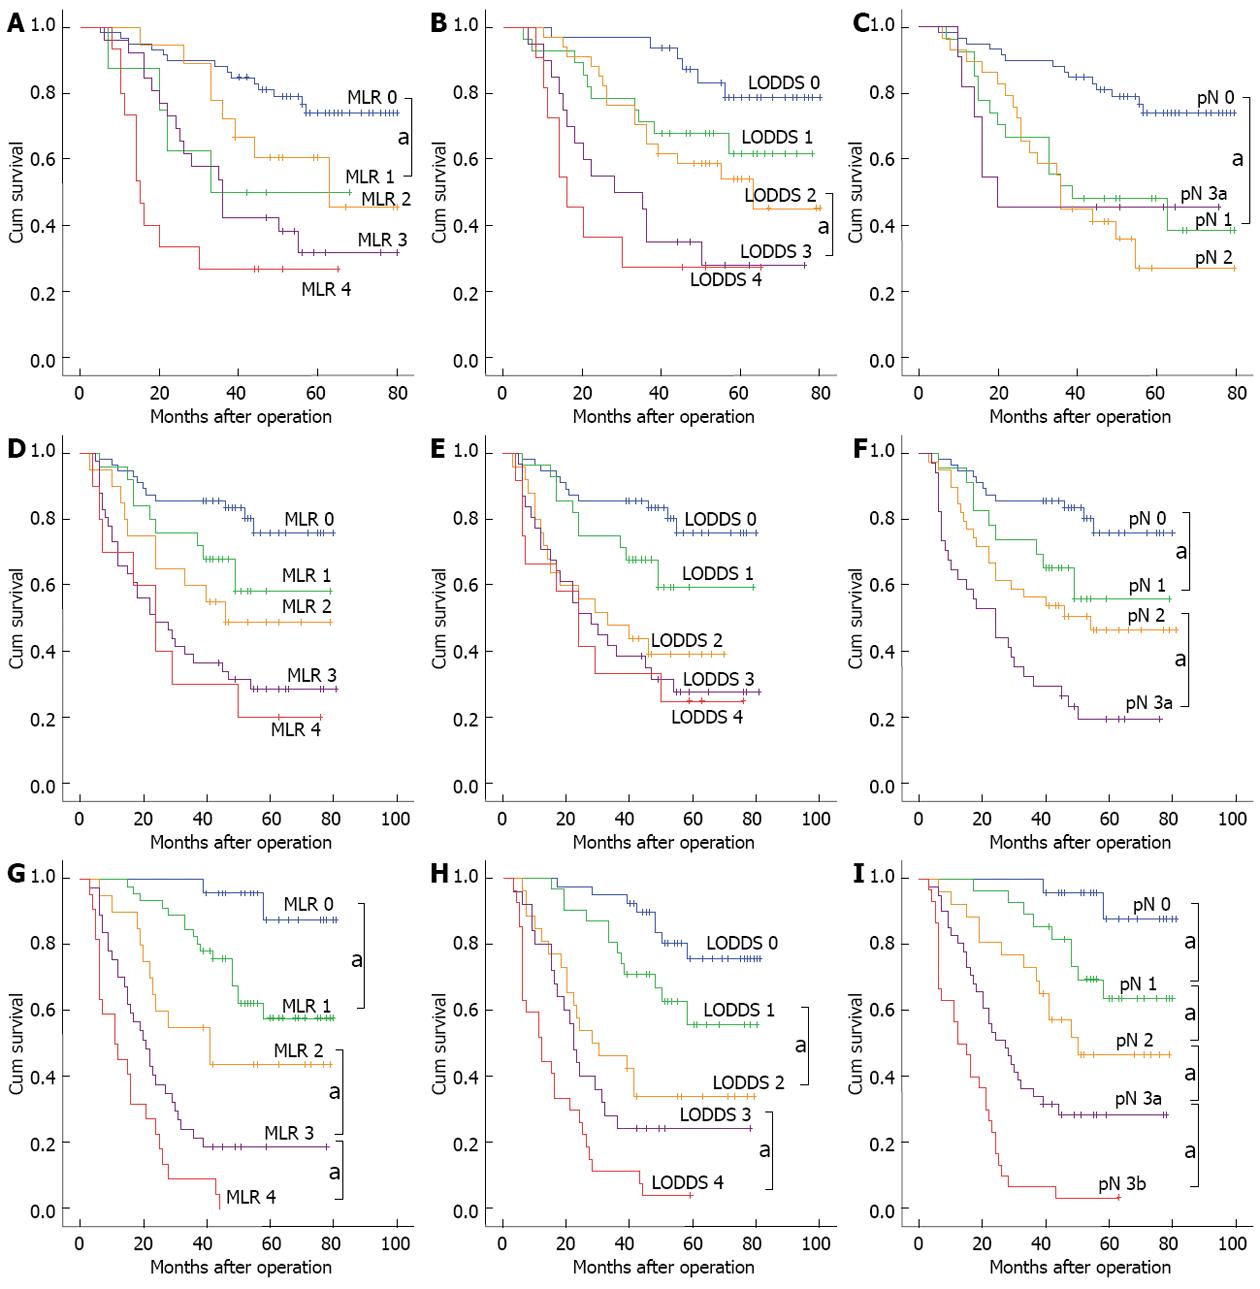
Figure 2 Comparison of survival curves in 3 staging system according to the number of lymph nodes retrieved.
aP < 0.05 between adjacent stages. A: MLR, LN < 10; B: LODDS, LN < 10; C: pN, LN < 10; D: MLR, 10 ≤ LN ≤ 15; E: LODDS, 10 ≤ LN ≤ 15; F: pN, 10 ≤ LN ≤ 15; G: MLR, LN > 15; H: LODDS, LN > 15; I: pN, LN > 15. MLR: Metastatic lymph node ratio; LODDS: Log odds of positive lymph nodes; pN: Positive lymph nodes; LN: Examined lymph nodes.
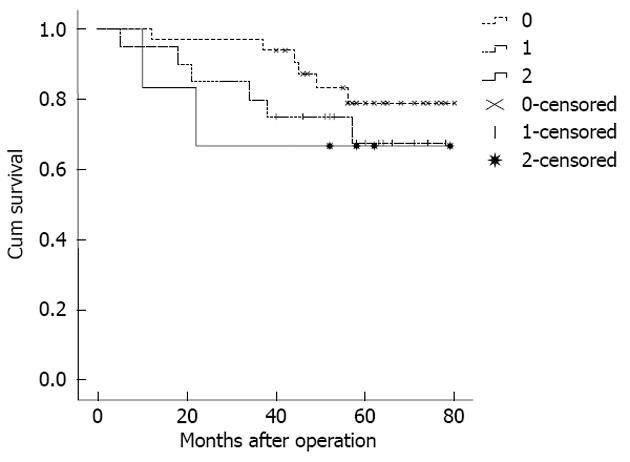
Figure 3 Survival curve of no positive lymph nodes patients with < 10 tested lymph nodes re-staged with the log odds of positive lymph nodes staging method.
- Citation: Xu J, Bian YH, Jin X, Cao H. Prognostic assessment of different metastatic lymph node staging methods for gastric cancer after D2 resection. World J Gastroenterol 2013; 19(12): 1975-1983
- URL: https://www.wjgnet.com/1007-9327/full/v19/i12/1975.htm
- DOI: https://dx.doi.org/10.3748/wjg.v19.i12.1975


