Copyright
©2013 Baishideng Publishing Group Co.
World J Gastroenterol. Mar 28, 2013; 19(12): 1877-1889
Published online Mar 28, 2013. doi: 10.3748/wjg.v19.i12.1877
Published online Mar 28, 2013. doi: 10.3748/wjg.v19.i12.1877
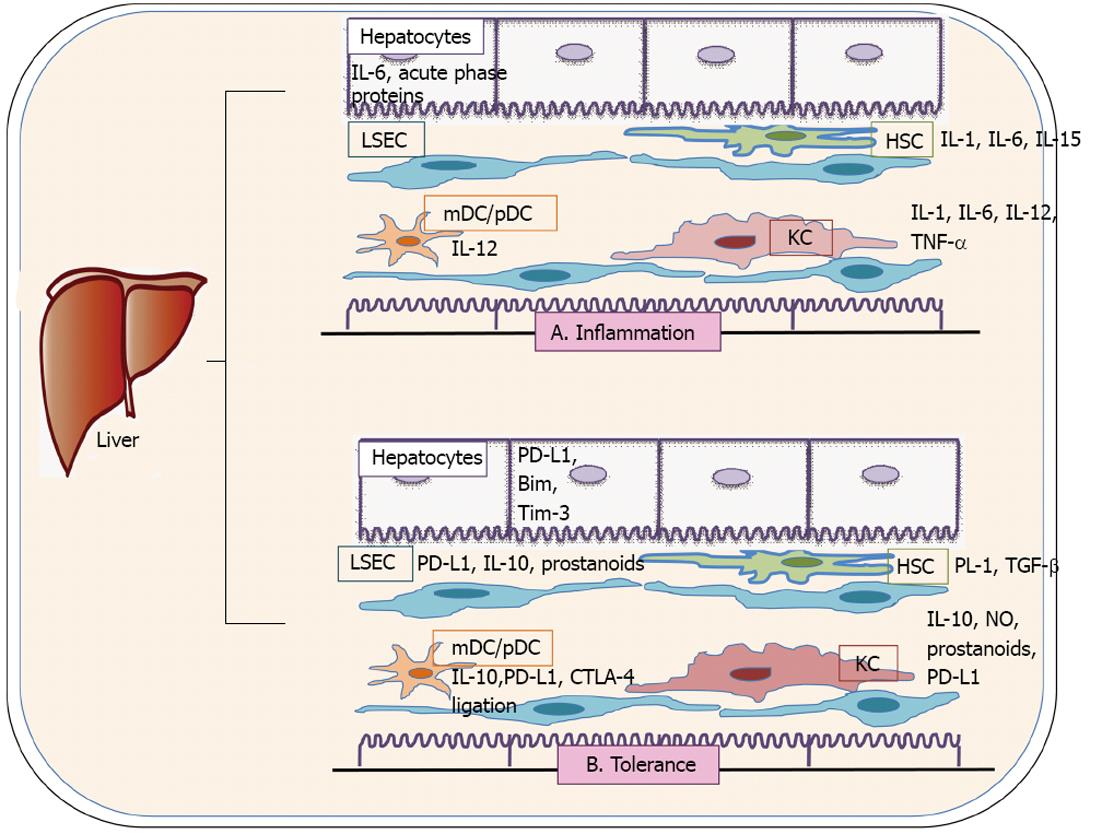
Figure 1 Collective illustration of the hepatic cells with inflammatory and tolerance activities by stimulation of different molecules or receptors.
LSEC: Liver sinusoidal endothelial cells; KC: Kuffer cells; DC: Dendritic cells; HSC: Hepatic stellate cells; TNF: Tumor necrosis factor; IL: Interleukin; mDC: Myeloid dendratic cell; pDC: Plasmacytoid dendritic cell; PD-L1: Programmed death ligand-1; Bim: BCL-2 interacting mediator; Tim-3: T cell immunoglobulin mucin-3; CTLA-4: Cytotoxic T-lymphocyte antigen 4; TGF: Transforming growth factor; NO: Nitric oxide.
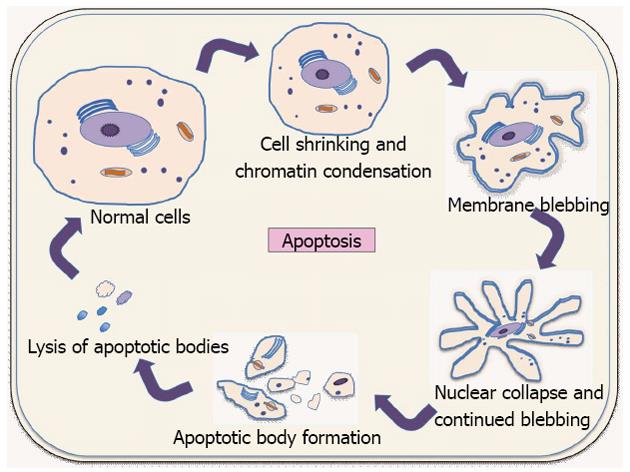
Figure 2 Apoptosis-programmed cell death.
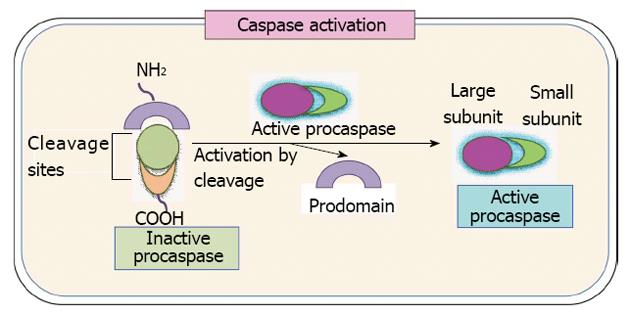
Figure 3 Caspase activation: Inactive proenzyme (procaspase) activated by proteolytic cleavage by another member of caspase family and cleaved two fragments associate to form the active site of the caspase.
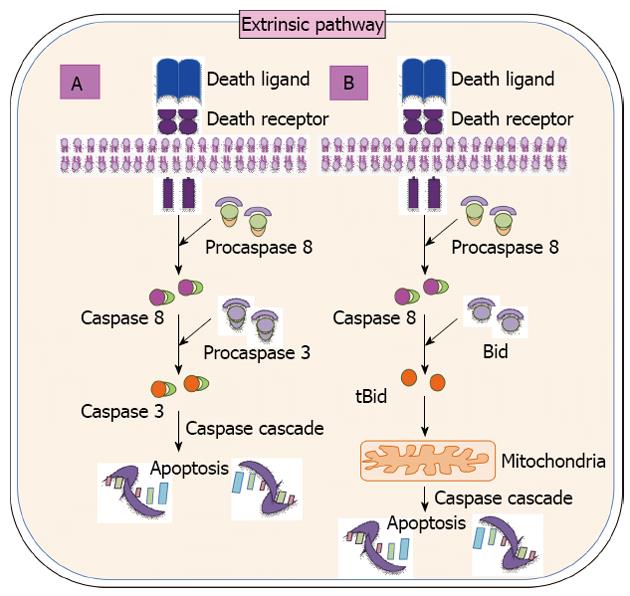
Figure 4 Extrinsic pathway.
A: Mitochondria-independent extrinsic pathway: Fas-FasL ligation strikes to recruit pro-caspase 8 activation and induction of caspase cascade by caspase 3 leading to apoptosis; B: Mitochondria-dependent extrinsic pathway: Fas-FasL ligation trigger to activate the pro-caspase 8, which cleave Bid (pro-apoptotic Bcl-2 family molecule) to form truncated Bid (tBid). Then, mitochondrial dependent cell death begins with tBid.
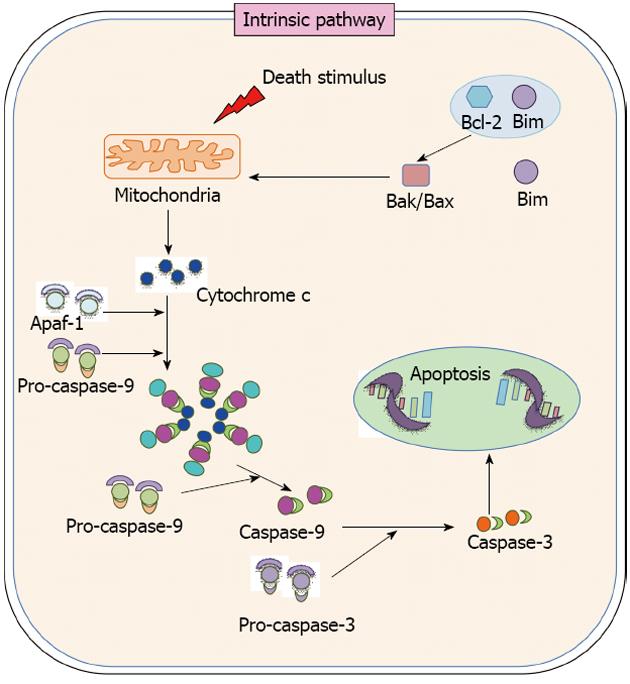
Figure 5 Intrinsic pathway.
Death stimulation up regulates Bcl-2 interacting mediator leading to the separation from Bcl-2, favoring the activation of Bax, Bak, which form pores in the mitochondrial membrane leading to release of cytochrome c. Cytochrome c with Apaf-1 and procaspase 9 participate in the formation of apoptosome, which activate caspase 9. Caspase-9 activates caspase 3 after cleavage of pro-caspase-3. That caspase-3 triggers to induction of caspase cascade and cell death. Apaf-1: Apoptosis protease-activating factor-1. Bim: Bcl-2 interacting mediator.
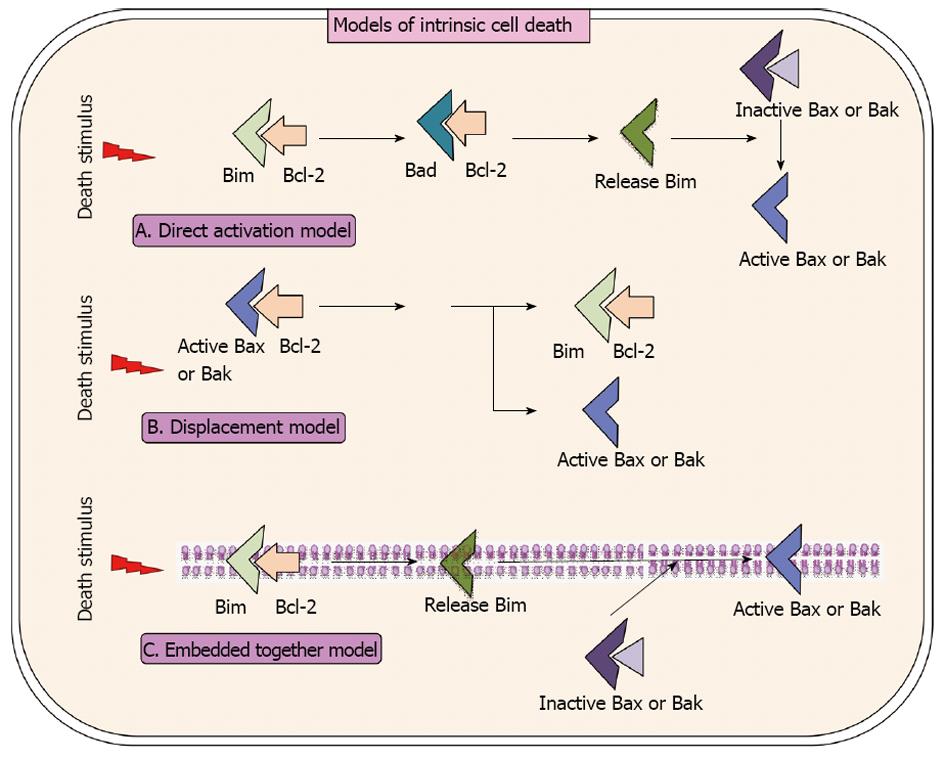
Figure 6 Models for intrinsic cell death.
A: Direct activation model postulates Bcl-2 interacting mediator (Bim) is required for activating Bax and Bak. Anti-apoptotic proteins inhibit BH3-only proteins to suppress apoptosis, but not Bax or Bak. Replacement of Bim to sensitizer BH3-proteins from the anti-apoptotic proteins occurs to promote apoptosis; B: The displacement model proposes that anti-apoptotic proteins for cell survival must sequester constitutively active Bax and Bak in cells. Bim inhibits their respective anti-apoptotic proteins by playing sensitizer role to promote apoptosis; C: Embedded together model highlights the active role of the membrane, which is not defined in direct activation model and displacement model. Bcl-2 family proteins insert into and change their conformations that dictate their functions at the membrane. Sensitizer BH3-only proteins relocate the activator BH3-only proteins and Bax/Bak from the anti-apoptotic proteins to endorse apoptosis. Activator BH3-only proteins recruit Bax to the membrane to induce mitochondrial outer membrane permeabilization and apoptosis. These reversible interactions are directed by equilibrium constants that are depended on the concentrations and interactions of the proteins with each other and with membranes.
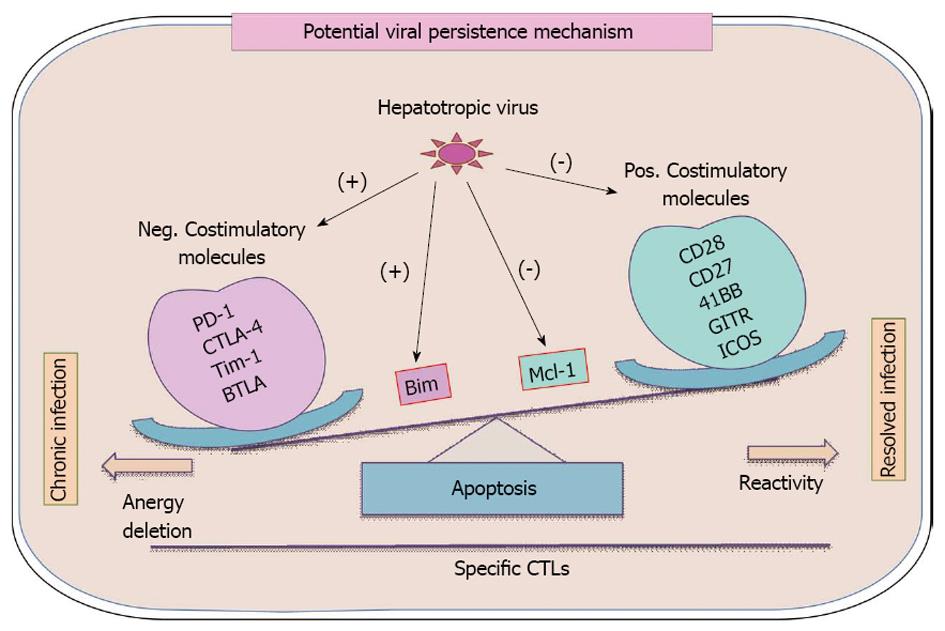
Figure 7 Balance between co-stimulatory/apoptotic molecules and viral-specific cytotoxic T lymphocytes reactivity according to infection outcome.
Neg.: Negative; Pos.: Positive; CTLs: Cytotoxic T lymphocytes; (+): Possible molecules induced by viral infection; (-): Possible molecules down-regulated by viral infection; BIM: Bcl-2 interacting mediator; Mcl-1: Myeloid cell leukemia sequence-1.
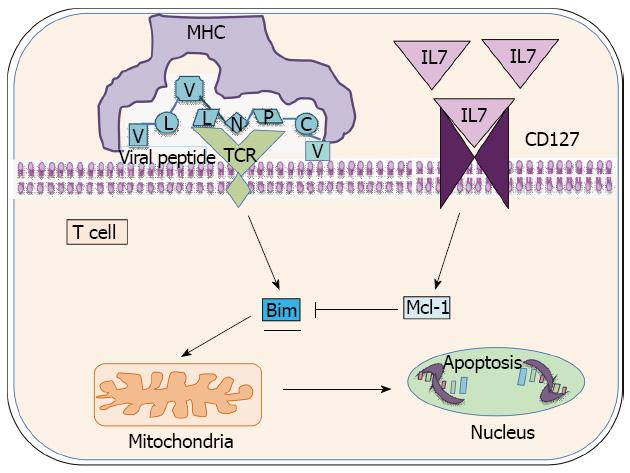
Figure 8 Cell survival marker CD127 modulates Bim and myeloid cell leukemia sequence-1 expression on hepatitis C virus-specific cytotoxic T lymphocytes after cognate antigen stimulation.
Misbalance of Mcl-1/Bcl-2 interacting mediator (Bim) triggers to apoptosis of hepatitis C virus specific cytotoxic T lymphocytes. TCR: T cell receptor; Mcl-1: Myeloid cell leukemia sequence-1.
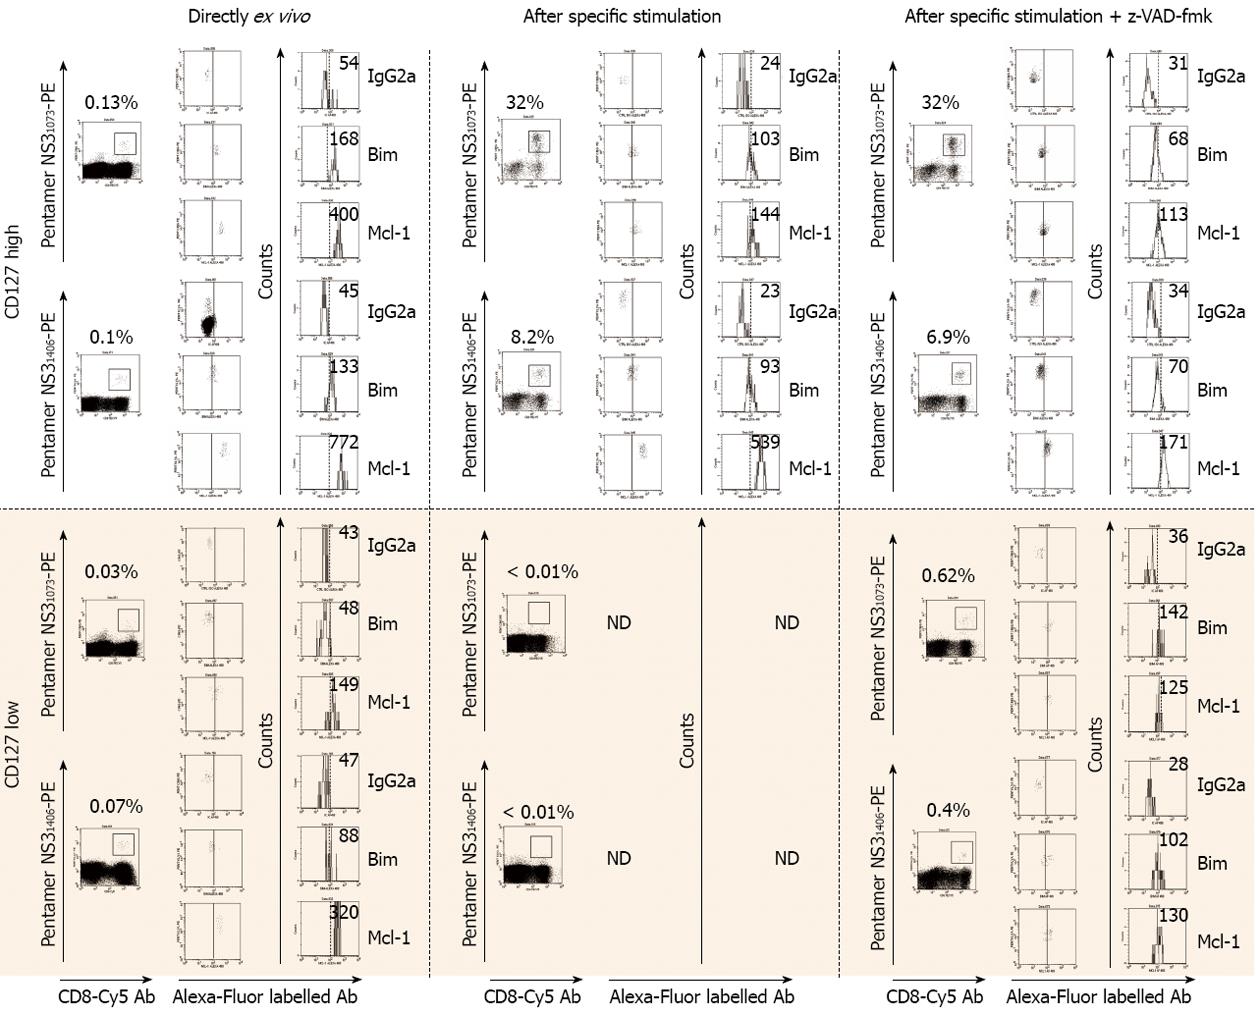
Figure 9 Figure illustrated the FACSan® dot plots and histograms from peripheral blood lymphocytes from two hepatitis C virus patients with different CD127 expression on hepatitis C virus-specific cytotoxic T lymphocytes (CD8+/Pentamer+ cells).
The different plots show the Bcl-2 interacting mediator (Bim) and myeloid cell leukemia sequence-1 (Mcl-1) expression directly ex vivo and after specific stimulation on peripheral CD8+/pentameter+ cells according to CD127 level. The figure on the top of the dot-plots represents the frequency of penatmer+ cells out of total CD8+ cells. The figure in the upper right corner in the histogram plot represents the MFI for Bim and Mcl-1 staining. The continuous and dashed line in the dot-plots and histograms represents the cut-off point to consider a staining positive according to the negative control. ND: Not done due to lack of pentamer+/CD8+ proliferation after specific stimulation.
- Citation: Larrubia JR, Lokhande MU, García-Garzón S, Miquel J, Subirá D, Sanz-de-Villalobos E. Role of T cell death in maintaining immune tolerance during persistent viral hepatitis. World J Gastroenterol 2013; 19(12): 1877-1889
- URL: https://www.wjgnet.com/1007-9327/full/v19/i12/1877.htm
- DOI: https://dx.doi.org/10.3748/wjg.v19.i12.1877


