Copyright
©2012 Baishideng Publishing Group Co.
World J Gastroenterol. Mar 7, 2012; 18(9): 991-998
Published online Mar 7, 2012. doi: 10.3748/wjg.v18.i9.991
Published online Mar 7, 2012. doi: 10.3748/wjg.v18.i9.991
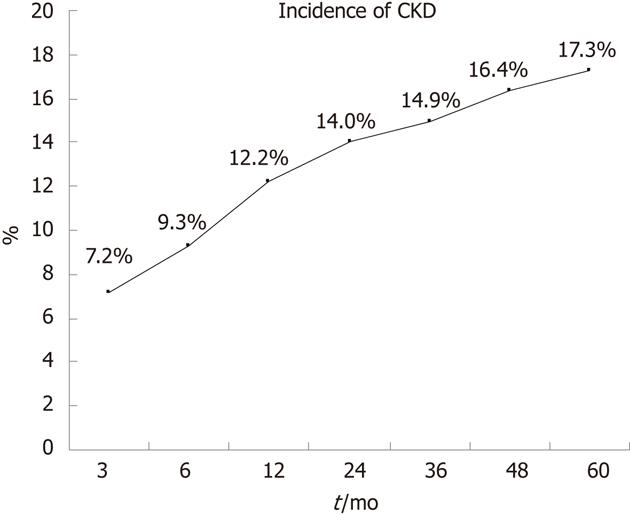
Figure 1 Incidence of chronic kidney disease 5 years after liver transplantation.
The estimated glomerular filtration rate (eGFR) was calculated by the abbreviated Modification of Diet in Renal Disease formula after each visit of a patient. And once met the criterion of chronic kidney disease (CKD) (eGFR < 60 mL/min per 1.73 m2), they were registered into the CKD group. Seventeen point three percents of the whole population (99 cases) developed CKD during the 5-year’s follow-up.
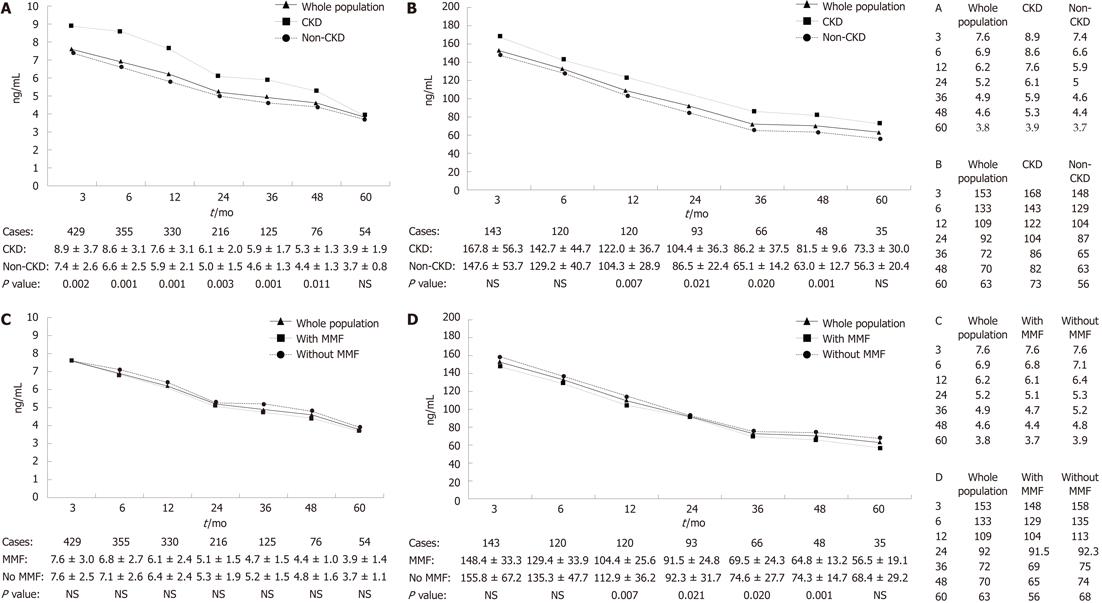
Figure 2 Calcineurin inhibitor trough concentrations between different groups.
We compared the mean trough concentrations of tacrolimus (TAC) and cyclosporine A (CSA) at different time points between patients with and without chronic kidney disease (CKD) (A and B), between patients combined mycophenolate mofetil (MMF) use and no use (C and D). A: Trough concentrations of TAC grouped by CKD and non-CKD at different time points. Apart from 5 years after liver transplantation (LT), the CKD people had higher TAC trough concentrations than non-CKD people with statistical significance; B: Trough concentrations of CSA grouped by CKD and non-CKD at different time points. The CKD people had higher CSA trough concentrations than non-CKD people with statistical significance in 1, 2, 3, 4 years after LT; C and D: Trough concentrations of TAC (C) and CSA (D) grouped by combination with and without MMF at different time points. Patients with MMF combination had a lower calcineurin inhibitor trough concentrations but most without statistical significance. NS: Not significant.
- Citation: Shao ZY, Yan LN, Wang WT, Li B, Wen TF, Yang JY, Xu MQ, Zhao JC, Wei YG. Prophylaxis of chronic kidney disease after liver transplantation - experience from west China. World J Gastroenterol 2012; 18(9): 991-998
- URL: https://www.wjgnet.com/1007-9327/full/v18/i9/991.htm
- DOI: https://dx.doi.org/10.3748/wjg.v18.i9.991


