Copyright
©2012 Baishideng Publishing Group Co.
World J Gastroenterol. Feb 21, 2012; 18(7): 627-636
Published online Feb 21, 2012. doi: 10.3748/wjg.v18.i7.627
Published online Feb 21, 2012. doi: 10.3748/wjg.v18.i7.627
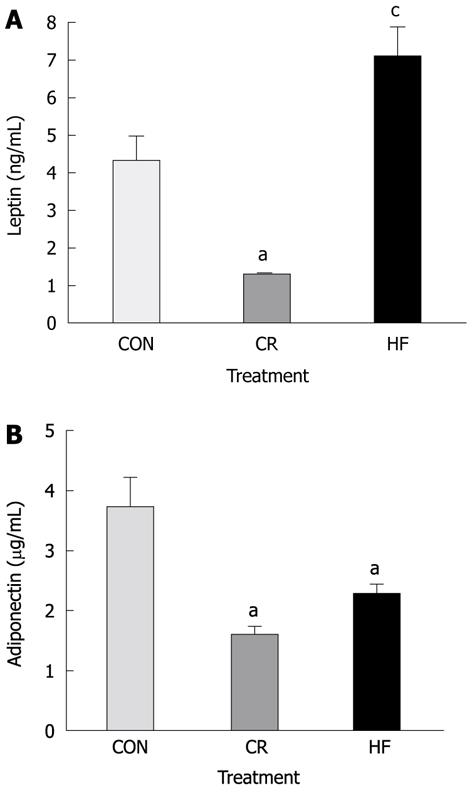
Figure 1 Plasma adipokines in SMAD3-/- mice after 20 wk on dietary treatment.
A: Average plasma concentrations of leptin between diet groups prior to infection. Calorie restricted (CR) mice had significantly lower concentrations, whereas high fat (HF) mice had significantly higher concentrations of leptin compared to control (CON) mice (P < 0.01); B: Average plasma concentrations of adiponectin between diets prior to infection. Both CR and HF diet mice had significantly lower concentrations of adiponectin than mice on CON diet (P < 0.05). aP < 0.05 vs control; cP < 0.05 vs all other groups.
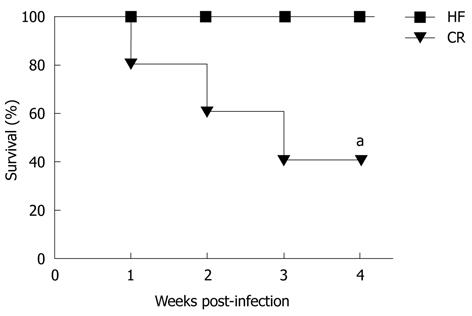
Figure 2 Survival curve of high fat, control and calorie restricted mice after infection with Helicobacter hepaticus.
Calorie restricted (CR) mice experienced increased mortality after infection, with only 40% of CR mice surviving 4 wk post-infection. aP < 0.05 vs baseline. HF: High fat.
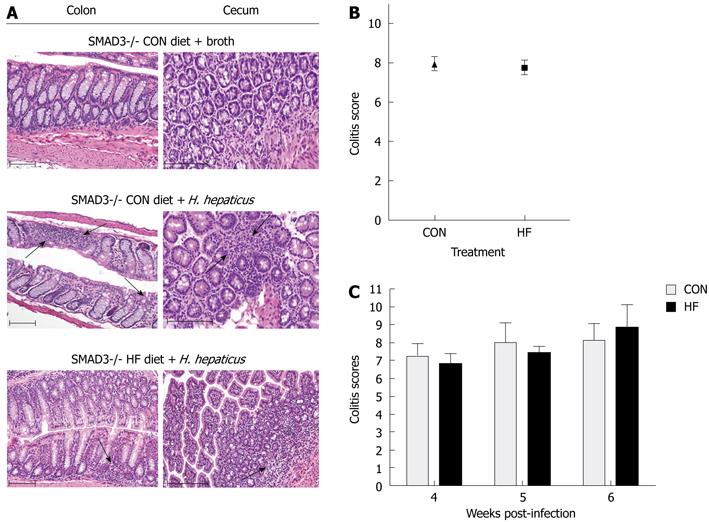
Figure 3 Effect of dietary treatment on colitis severity in SMAD3-/- mice.
A: HE stained sections from the colon and cecum of SMAD3-/- control (CON)-fed mice treated with broth and SMAD3-/- CON- or high fat (HF)-fed mice 4 wk post-infection. Four weeks following infection, the number of inflammatory cells in the lamina propria is increased in the colon and cecum of both CON and HF diet animals, consistent with mild inflammation (arrows denote). Scale bars represent 100 μm; B: Average combined colitis and dysplasia scores between diet groups at 4 wk post-infection. There was no significant difference in theses scores between the CON and HF diet treatment groups; C: Average combined colitis and dysplasia scores between CON and HF mice at 4 wk, 5 wk and 6 wk post-infection. There was no difference between CON and HF diet groups at any point, and there was no effect of time on the scores between diets. H. hepaticus: Helicobacter hepaticus; HE: Hematoxylin and eosin.
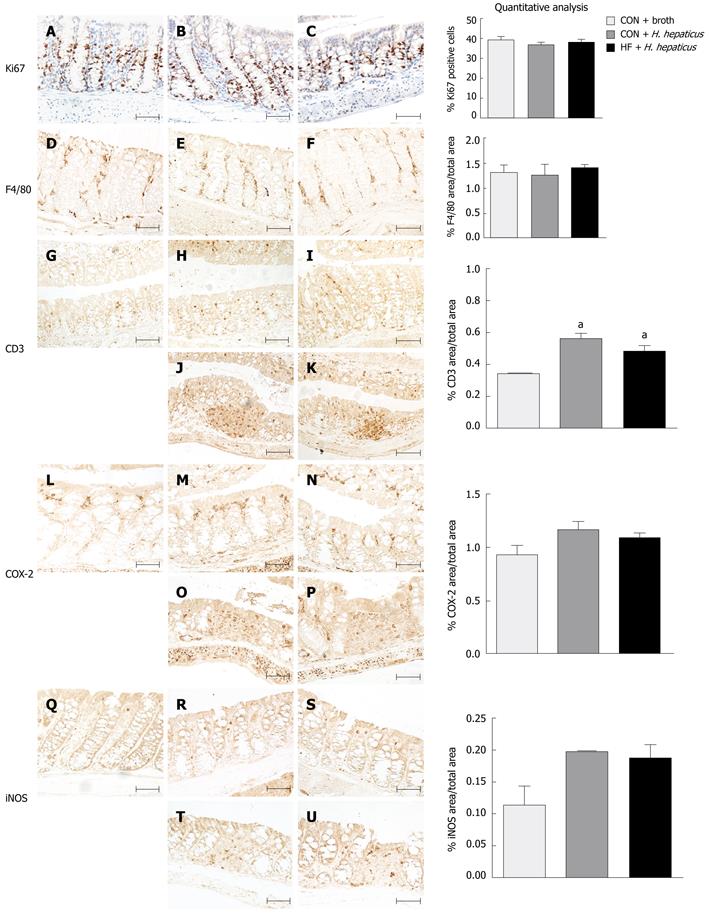
Figure 4 Effect of diet on proliferation and inflammatory markers following infection with Helicobacter hepaticus in SMAD3-/- mice.
Immunohistochemical staining for Ki-67 (A-C), F4/80 (D-F), CD3 (G-K), COX-2 (L-P) and iNOS (Q-U) in proximal colon sections of SMAD3-/- mice fed control (CON) diet and treated with broth (A, D, G, L, Q), CON-fed mice treated with Helicobacter hepaticus (H. hepaticus) (B, E, H, J, M, O, R, T), or fed a high fat (HF) diet and treated with H. hepaticus (C, F, I, K, N, P, S, U) 4 wk post-infection. Normal appearing proximal colon segments (A-I, L-N, Q-S) and inflamed colon segments with lymphoid infiltrate (J, K, O, P, T, U). Scale bars represent 100 μm. There were no significant differences in proliferation indices or in macrophage infiltration. CON and HF diet mice had slightly increased staining for CD3+ T lymphocytes, cyclooxygenase (COX)-2, and inducible nitric oxide synthase (iNOS) post-infection compared to broth-treated controls, but averages were not statistically significant between diets (P > 0.05). aP < 0.05 vs CON animals.
- Citation: McCaskey SJ, Rondini EA, Langohr IM, Fenton JI. Differential effects of energy balance on experimentally-induced colitis. World J Gastroenterol 2012; 18(7): 627-636
- URL: https://www.wjgnet.com/1007-9327/full/v18/i7/627.htm
- DOI: https://dx.doi.org/10.3748/wjg.v18.i7.627


