Copyright
©2012 Baishideng Publishing Group Co.
World J Gastroenterol. Feb 14, 2012; 18(6): 507-516
Published online Feb 14, 2012. doi: 10.3748/wjg.v18.i6.507
Published online Feb 14, 2012. doi: 10.3748/wjg.v18.i6.507
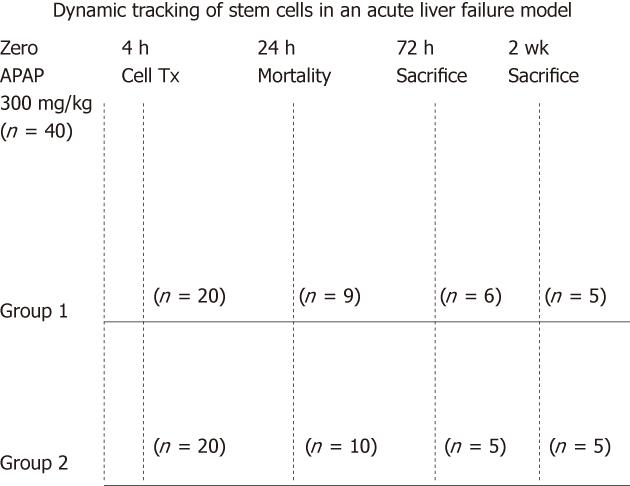
Figure 1 Experimental animal design.
Forty mice were treated with acetaminophen (APAP). The animals were then divided into 2 groups. The cell therapy group = Group 1 with cell transplantation and the control group = Group 2. During the first 24 h, 19/40 animals died due to the effect of APAP. Animals from both groups were then killed at 72 h when the signal started to decay and at two weeks when the signal could no longer be detected in vivo.
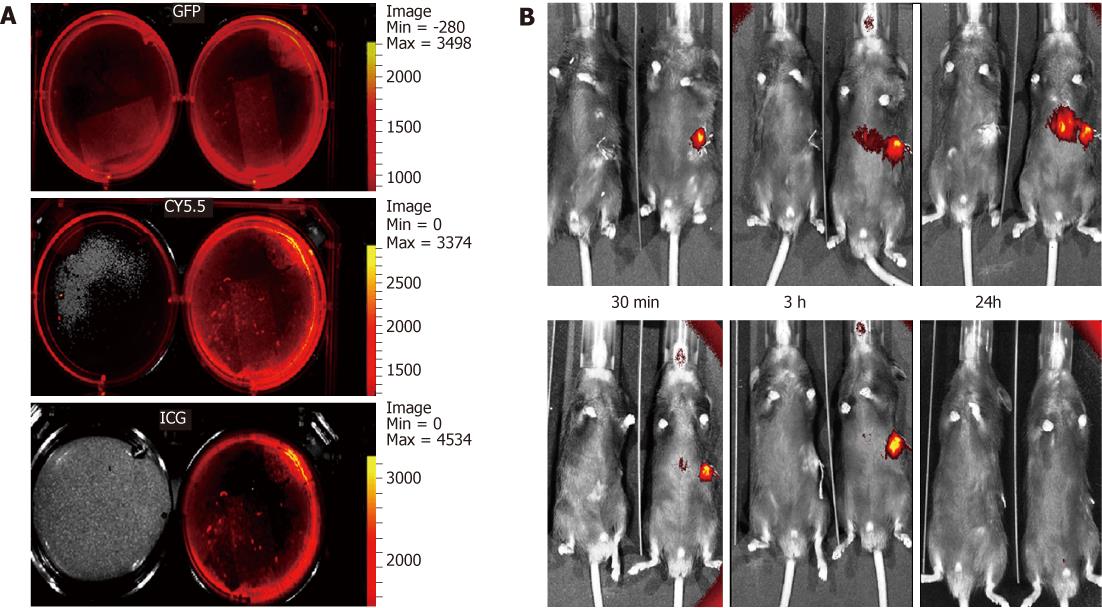
Figure 2 Labeling and tracking of the fluorescent embryonic stem cell following acetaminophen administration.
IVIS images of green fluorescence protein (GFP) +ve cultured embryonic stem cells (ESCs) without 1,1-dioctadecyl-3,3,3,3-tetramethylindotricarbocyanine iodide (DiR) staining (LT) and with DiR staining (RT) showing background fluorescence using the GFP and tricarbocyanine 5.5 filters, but not with the indocyanine green (ICG) filter (A). Images of a pair of mice (B), one from the cell therapy group-RT and the other from the control group-LT, were compared using IVIS. At 30 min following transplantation, a strong signal could only be detected from the spleen where the cells were injected. Between 3 and 24 h following the cell transplantation, the signal started to intensify between the spleen and the liver, which is most probably the splenic vein owing to its tortuous course. A strong signal was detected in the liver over 24 h post-transplantation, which faded out by the 72 h time-period. After one week, the signal could not be detected in the liver, but was still strong and was detectable over the spleen, which had completely disappeared by 2 wk.
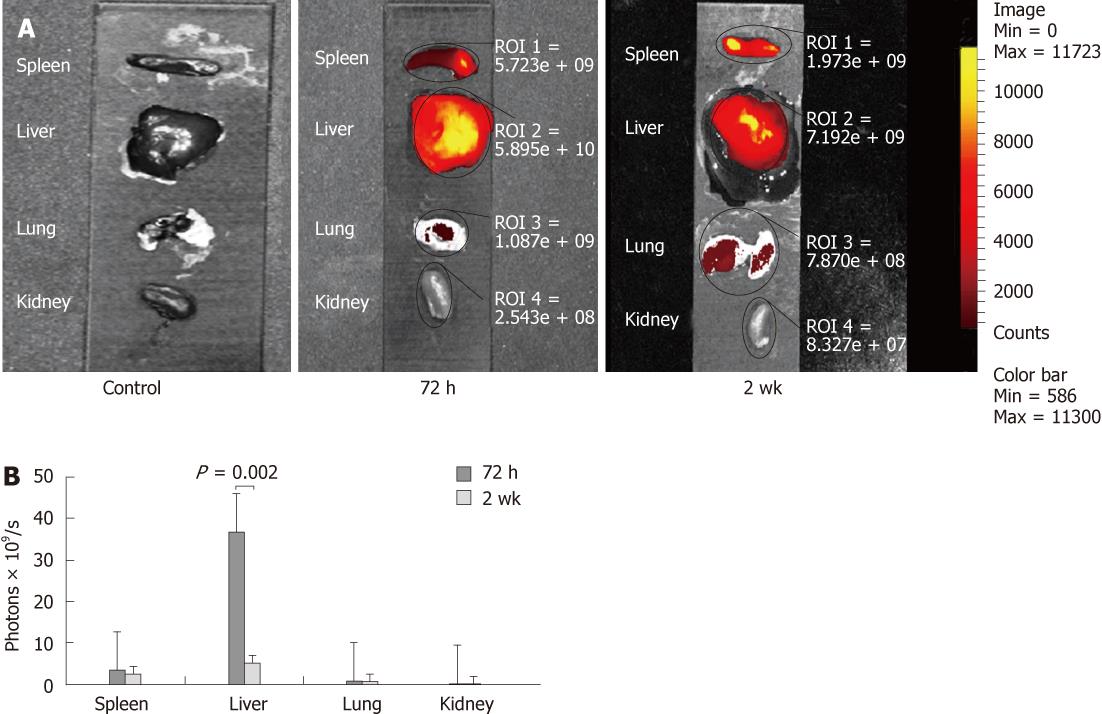
Figure 3 Ex vivo images showing the distribution of fluorescent cells in different organs as detected by the indocyanine green filter of the IVIS.
A signal was detected at the site of injection in the spleen; however, the highest signal was noticed in the center of the liver at 72 h. which faded out by the 2 wk time-point. A weak fluorescent signal was also detected in the lungs at 72 h and 2 wk, but not seen in kidneys at any time-points (A). A graph showing the highest uptake of cells in the liver at all time-points with a significant drop at 2 wk (B).
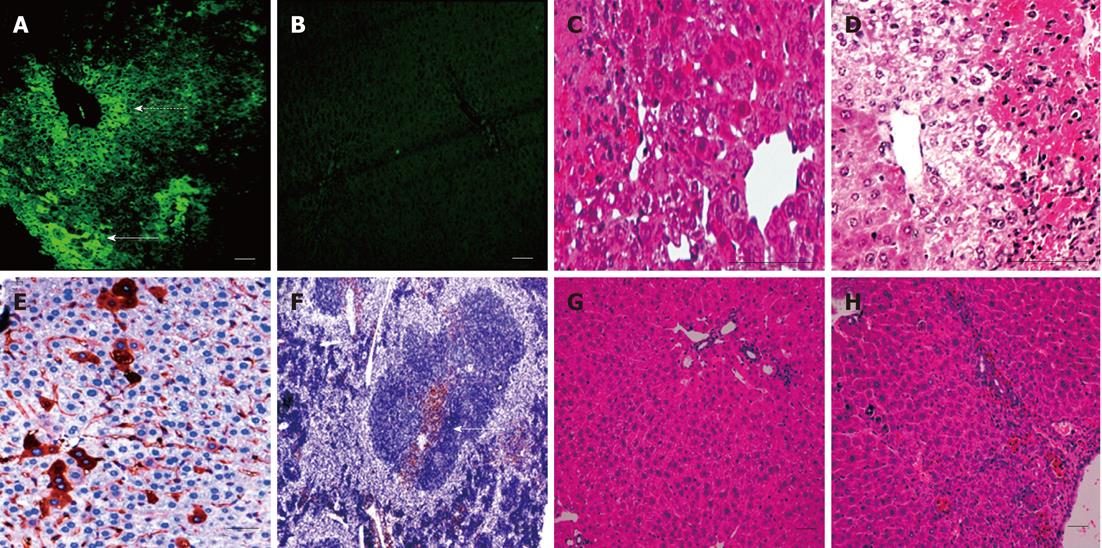
Figure 4 Embryonic stem cell liver engraftment following acetaminophen induced damage.
A and B: Green fluorescence protein (GFP) +ve cells were present under the liver capsule (a-solid arrow) and around the central veins of the liver at 72 h, as seen under direct fluorescence (a-dashed arrow) with no fluorescence detected in the control group (B); C and D: The characteristic pattern of acetaminophen-induced liver damage after 72 h mainly affected the centrilobular portions of the liver, with marked damage of the pericentral hepatocytes in both the cell therapy and control groups, although pericentral vacuolation was more evident in the control group; E: At 2 wk, the GFP +ve cells could be detected using IHC in the hepatic parenchyma and within the sinusoidal lining; F: Localized colonies of GFP +ve cells were also detected in the spleen at 2 wk; G and H: After 2 wk the liver recovered in both groups, with the liver sections from the cell therapy group (G) showing less inflammatory cells and congestion than in the control group (H) (scale bar = 200 μ).
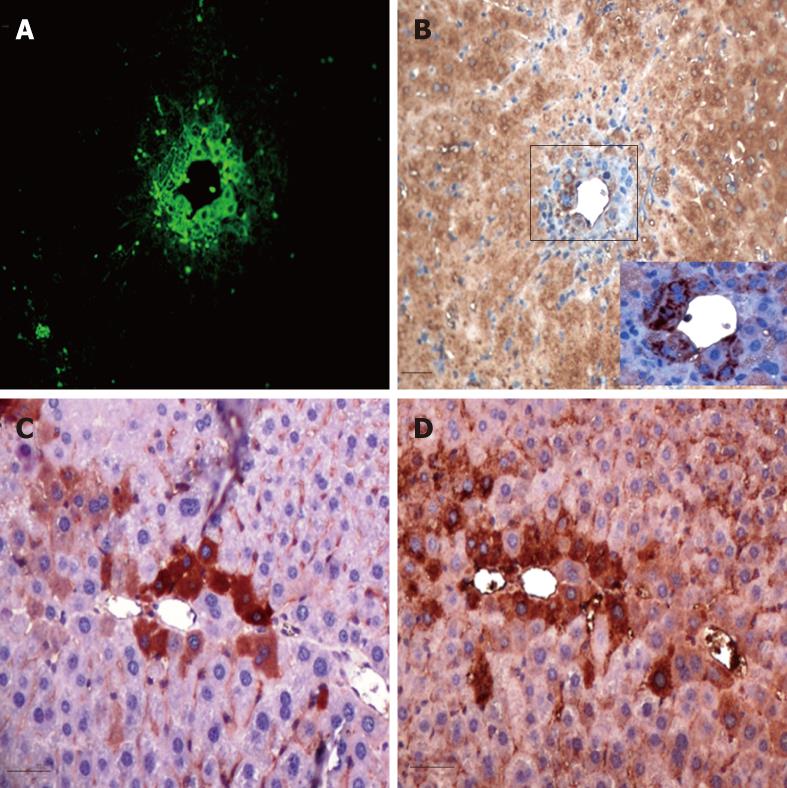
Figure 5 Serial sections examined for Green fluorescence protein and albumin expressions.
Green fluorescence protein (GFP) +ve transplanted cells (A) showed very faint albumin expression at the cell periphery of dividing cells at 72 h (B), whereas areas stained with anti-GFP antibody (C) were positive for albumin (D) at 2 wk following cell therapy (scale bar = 100 μ).
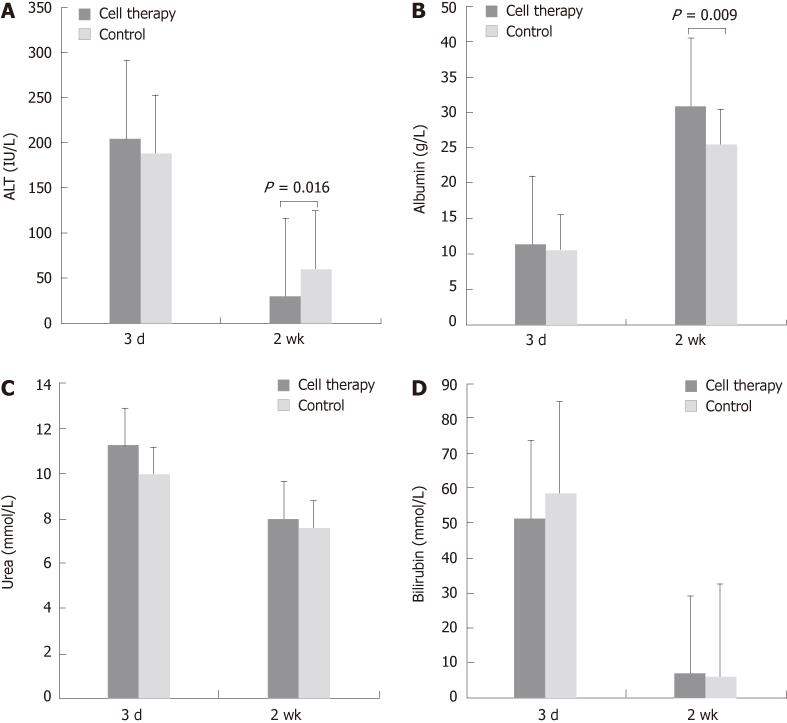
Figure 6 Serum levels of alanine aminotransferase, albumin, bilirubin and urea are shown (n = 21).
A: The alanine aminotransferase (ALT) level significantly dropped in both groups at 2 wk when compared with the 72 h. When compared with the 72 h, there was a significant reduction in serum ALT level at 2 wk in the embryonic stem cell treatment group, but not in the control group; B: The albumin level also improved in both groups with the level being significantly higher in the cell therapy group when compared with the control group at 2 wk; C: The drop in urea levels was not significant in either group; D: Bilirubin levels dropped significantly from 72 h to 2 wk, with no significant differences between groups at similar time-points.
- Citation: Ezzat T, Dhar DK, Malago M, Damink SWO. Dynamic tracking of stem cells in an acute liver failure model. World J Gastroenterol 2012; 18(6): 507-516
- URL: https://www.wjgnet.com/1007-9327/full/v18/i6/507.htm
- DOI: https://dx.doi.org/10.3748/wjg.v18.i6.507


