Copyright
©2012 Baishideng Publishing Group Co.
World J Gastroenterol. Dec 7, 2012; 18(45): 6605-6613
Published online Dec 7, 2012. doi: 10.3748/wjg.v18.i45.6605
Published online Dec 7, 2012. doi: 10.3748/wjg.v18.i45.6605
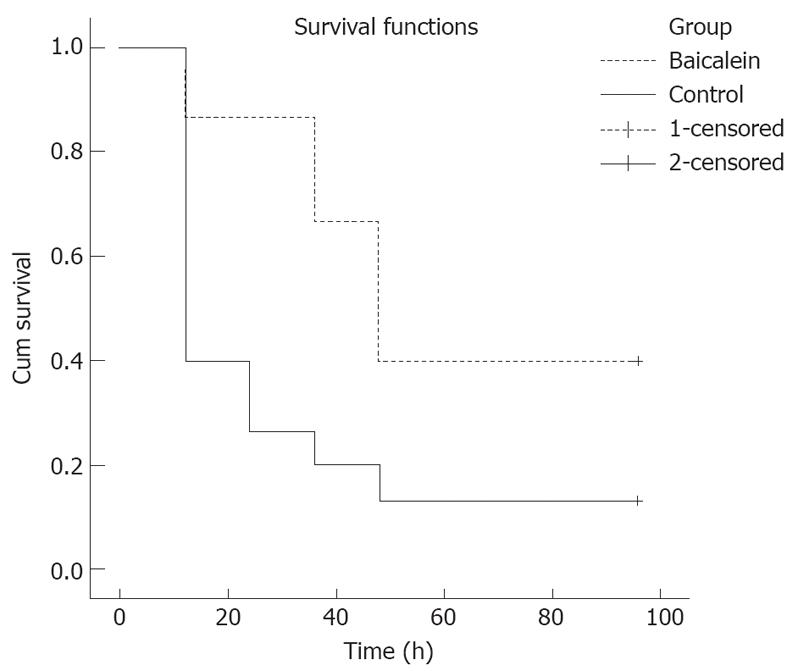
Figure 1 Baicalein increased probability of survival after a lethal dose of carbon tetrachloride (2.
6 mL/kg). Mice (n = 15) were administered with or without baicalein twice a day for 5 d. Survivals were scored twice a day, and the results were analyzed using the log-rank test and expressed as the Kaplan-Meier survival curves. P = 0.009 between control and baicalein groups.
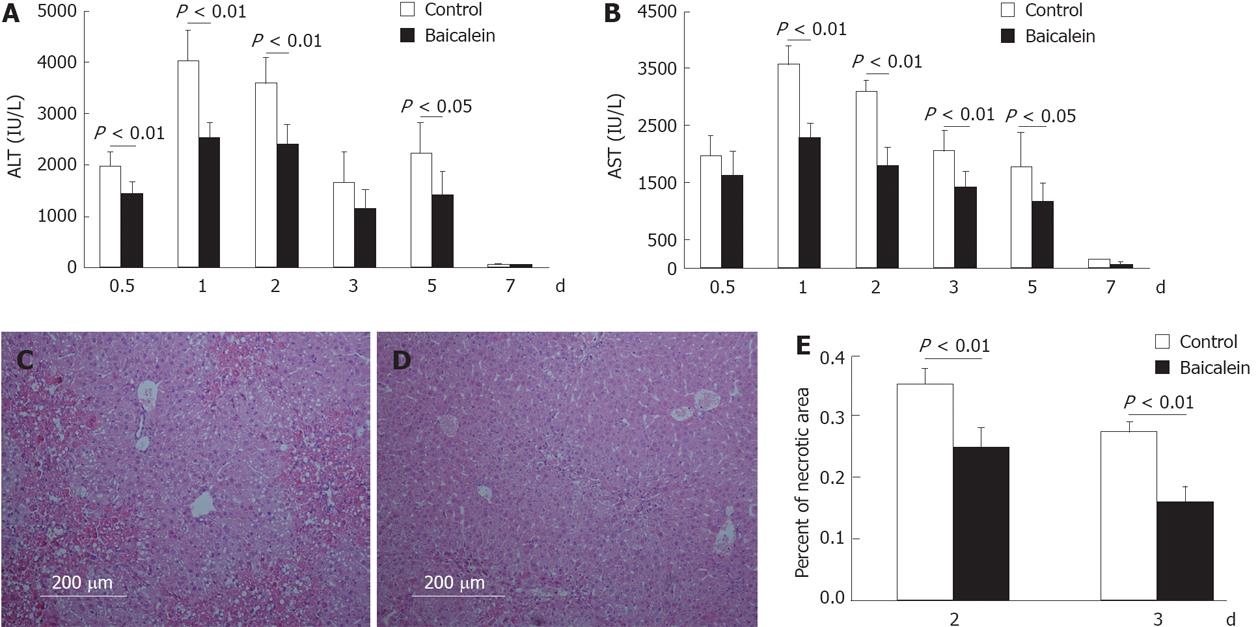
Figure 2 Baicalein protects liver against carbon tetrachloride induced acute liver injury.
A: Serum alanine aminotransferase (ALT); B: Serum aspartate aminotransferase (AST); C: Hematoxylin and eosin (HE) stained liver sections of control group 3 d after carbon tetrachloride (CCl4) treatment; D: HE stained liver sections of baicalein group 3 d after CCl4 treatment; E: Percent of necrotic areas in control group and baicalein group 2 and 3 d after CCl4 treatment. Mice received intraperitoneal CCl4 at the dosage of 1 mL/kg body weight (1:3 diluted in corn oil). Mice in baicalein group were orally administered baicalein (80 mg/kg) 1 h after CCl4 injection, twice a day for 4 d (original magnification, ×100). Necrosis with clusters of inflammatory cells around central vein was seen in control group; and histological recovery with only inconspicuous necrosis remaining around central vein, and very few inflammatory cells were present in the baicalein group. Control mice were treated with an equal volume of CMC-Na. Values represent mean ± SE (n = 6). P < 0.05, P < 0.01 between control and baicalein groups.
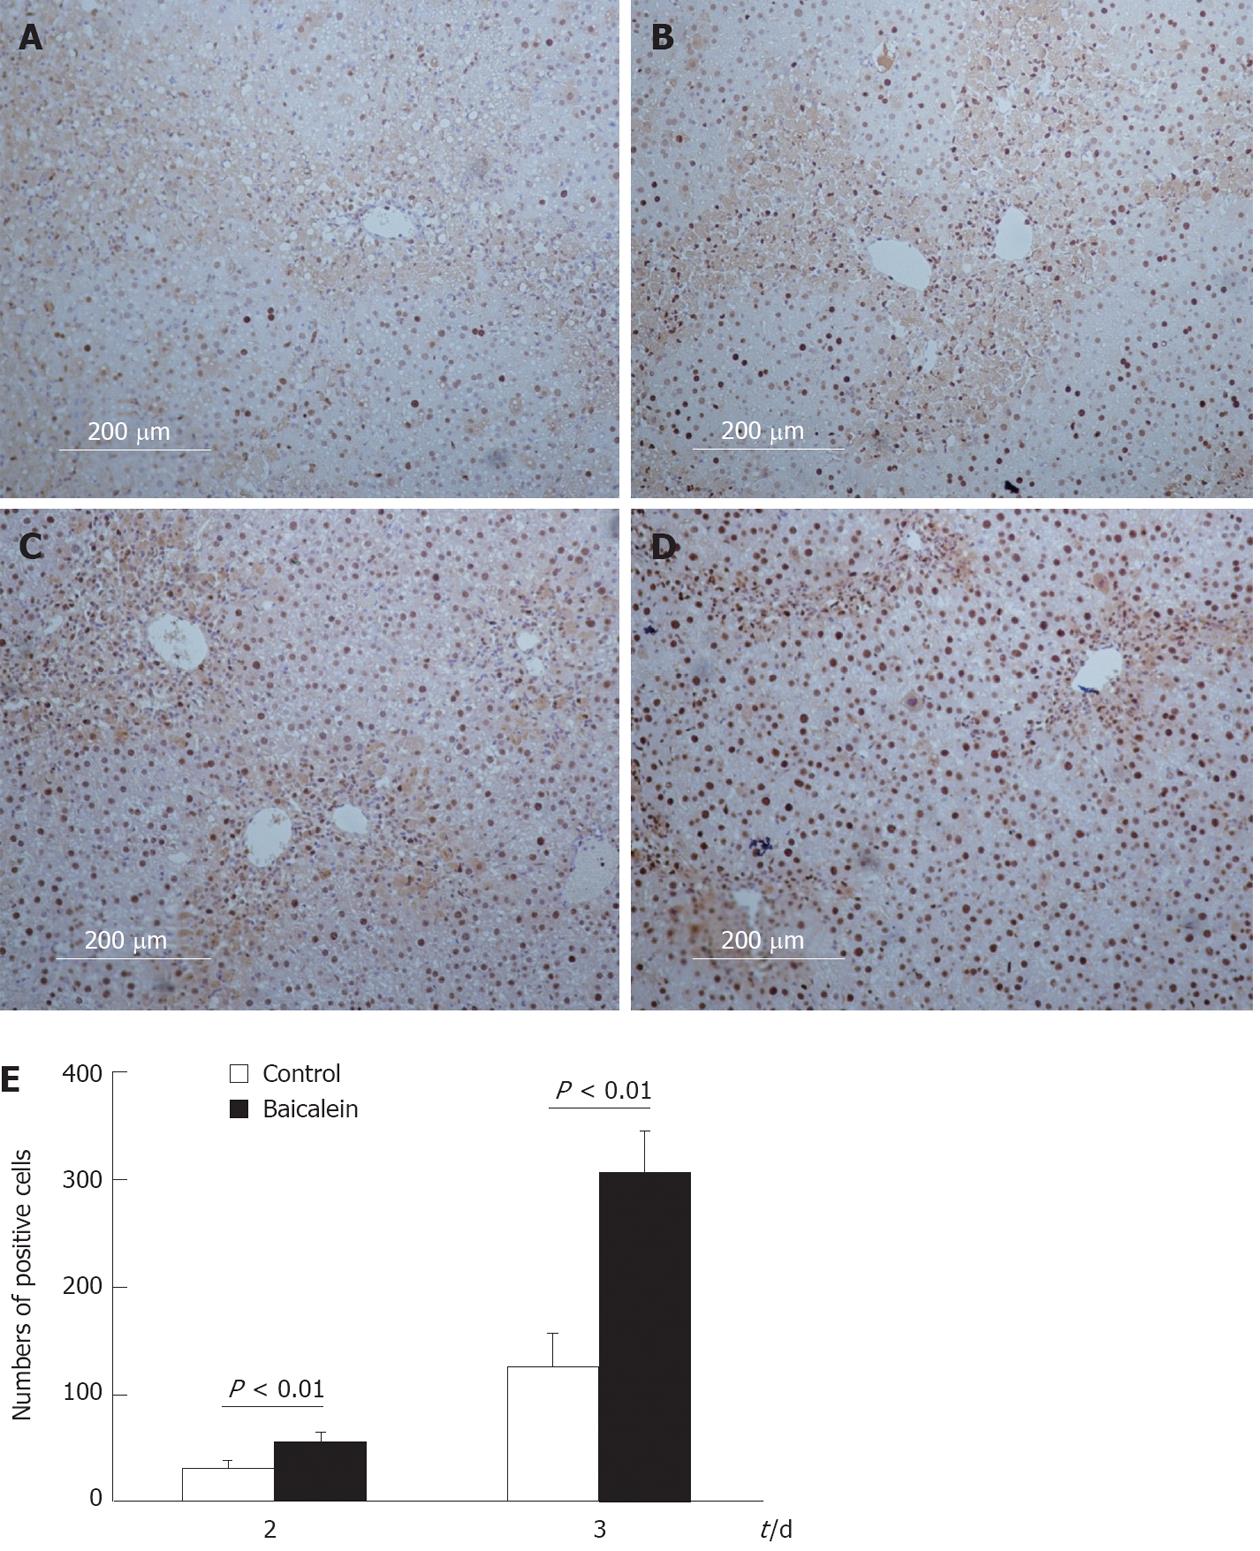
Figure 3 Proliferation status of carbon tetrachloride induced mice after treated with or without baicalein.
A, B: Immunostaining of proliferating cell nuclear antigen (PCNA) in liver sections from control (A) and baicalein (B) groups 2 d after carbon tetrachloride (CCl4) treatment; C, D: Immunostaining of PCNA in liver sections from control (C) and baicalein (D) groups 3 d after CCl4 treatment; E: Numbers of PCNA+ cells in CCl4 induced mice after treated with or without baicalein. At least six 12-mm2 tissue sections were counted for each mouse. Values represent mean ± SE (n = 6). P < 0.01 between control and baicalein groups.
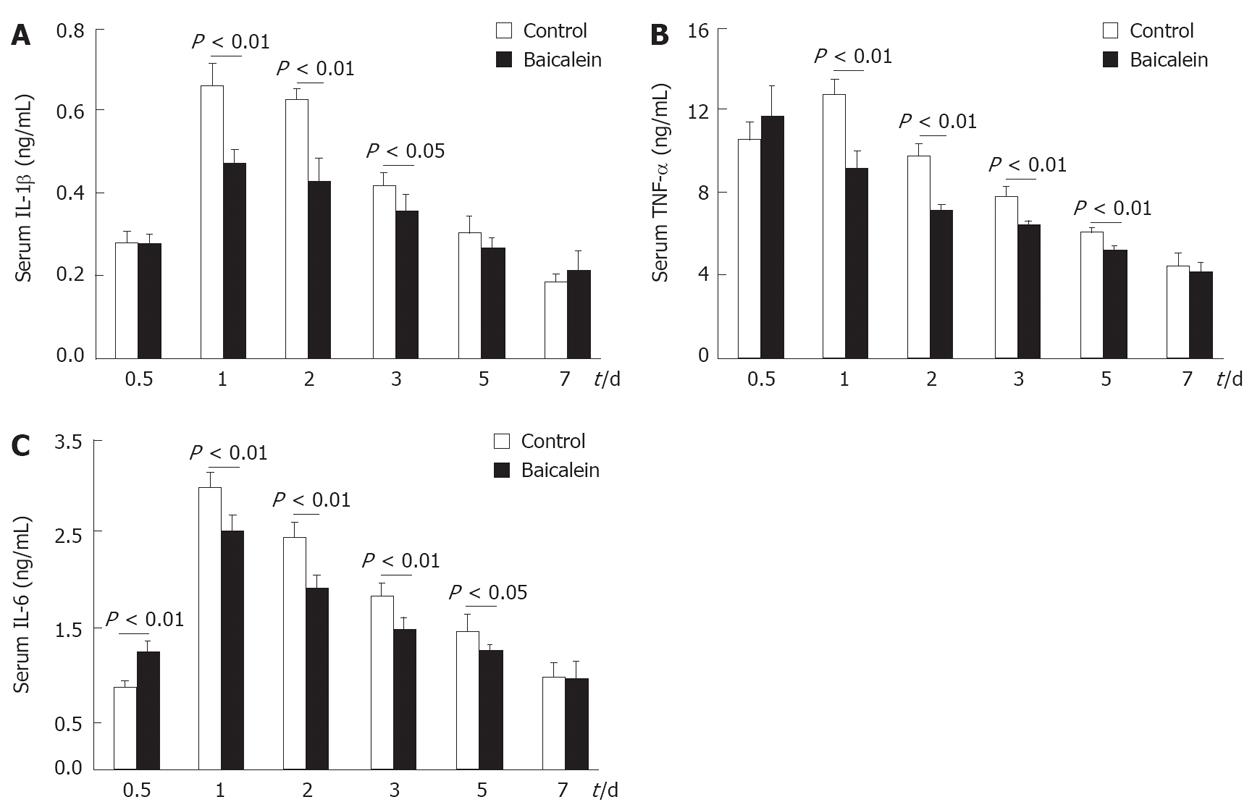
Figure 4 Levels of interleukin-1β, interleukin-6 and tumor necrosis factor-α in serum in control and baicalein groups after CCl4 (1 mL/kg) treatment.
A: Serum interleukin (IL)-1β; B: Serum tumor necrosis factor-α (TNF-α); C: Serum IL-6. A, B and C were determined by enzyme-linked immunosorbent assay kit. Values represent mean ± SE (n = 6). P < 0.05, P < 0.01 between control and baicalein groups.
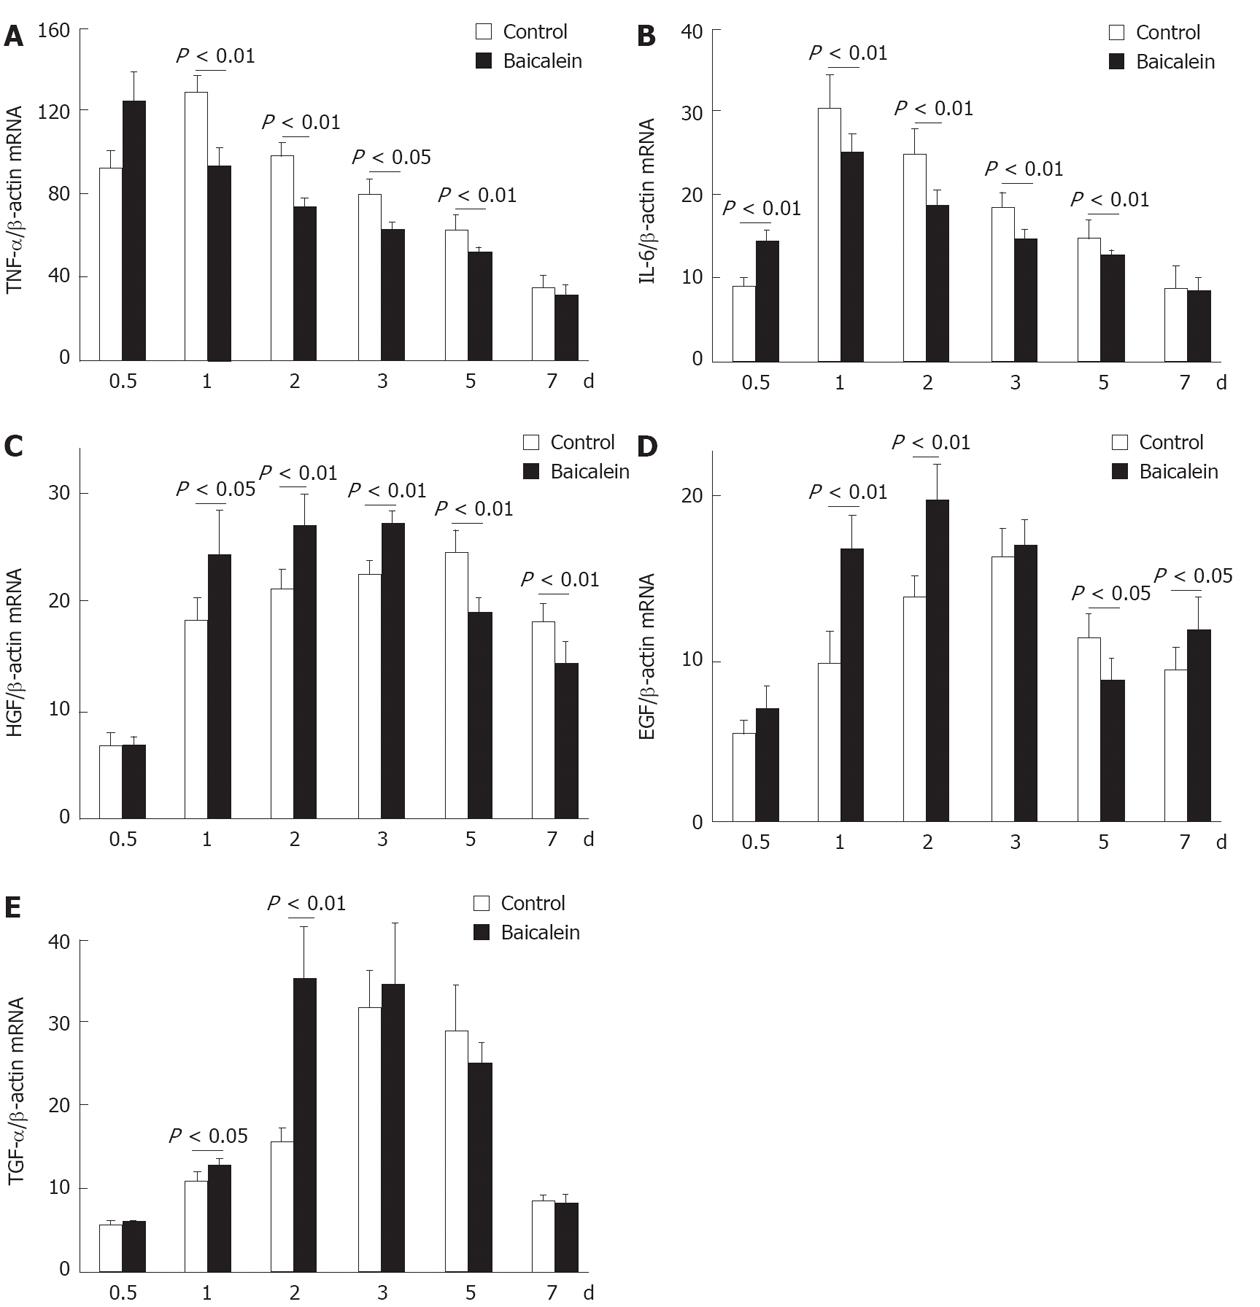
Figure 5 The microRNA levels of tumor necrosis factor-α, interleukin-6, transforming growth factor-α, hepatocyte growth factor and epidermal growth factor in liver of control and baicalein groups after carbon tetrachloride (1 mL/kg) treatment.
Total RNA was isolated from liver tissue using TRIzol methods and quantified spectrophotometrically at 260 nm. The mRNA levels of tumor necrosis factor-α (TNF-α) (A), interleukin-6 (IL-6) (B), hepatocyte growth factor (HGF) (C), epidermal growth factor (EGF) (D) and transforming growth factor-α (TGF-α) (E) genes were quantified using reverse transcription polymerase chain reaction and normalized to β-actin housekeeping gene. Values represent mean ± SE (n = 6). P < 0.05, P < 0.01 between control and baicalein groups.
- Citation: Huang HL, Wang YJ, Zhang QY, Liu B, Wang FY, Li JJ, Zhu RZ. Hepatoprotective effects of baicalein against CCl4-induced acute liver injury in mice. World J Gastroenterol 2012; 18(45): 6605-6613
- URL: https://www.wjgnet.com/1007-9327/full/v18/i45/6605.htm
- DOI: https://dx.doi.org/10.3748/wjg.v18.i45.6605


