Copyright
©2012 Baishideng Publishing Group Co.
World J Gastroenterol. Dec 7, 2012; 18(45): 6597-6604
Published online Dec 7, 2012. doi: 10.3748/wjg.v18.i45.6597
Published online Dec 7, 2012. doi: 10.3748/wjg.v18.i45.6597
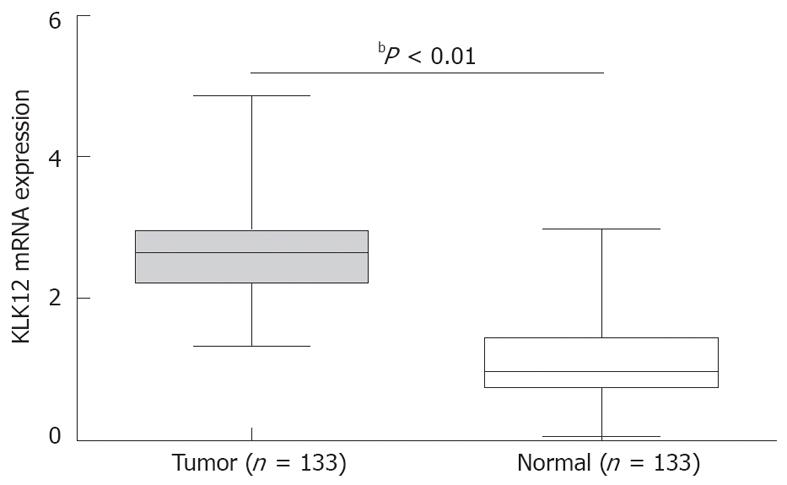
Figure 1 Upregulation of kallikrein 12 mRNA expression in gastric cancer.
Quantitative real-time reverse transcription polymerase chain reaction showed that the mean expression value of kallikrein 12 (KLK12) mRNA in cancer tissues was significantly higher than the value in relevant normal tissues. Data are shown as mean ± SD, using the Student’s t test (bP < 0.01 between tumor and normal group, horizontal bars represent medians).
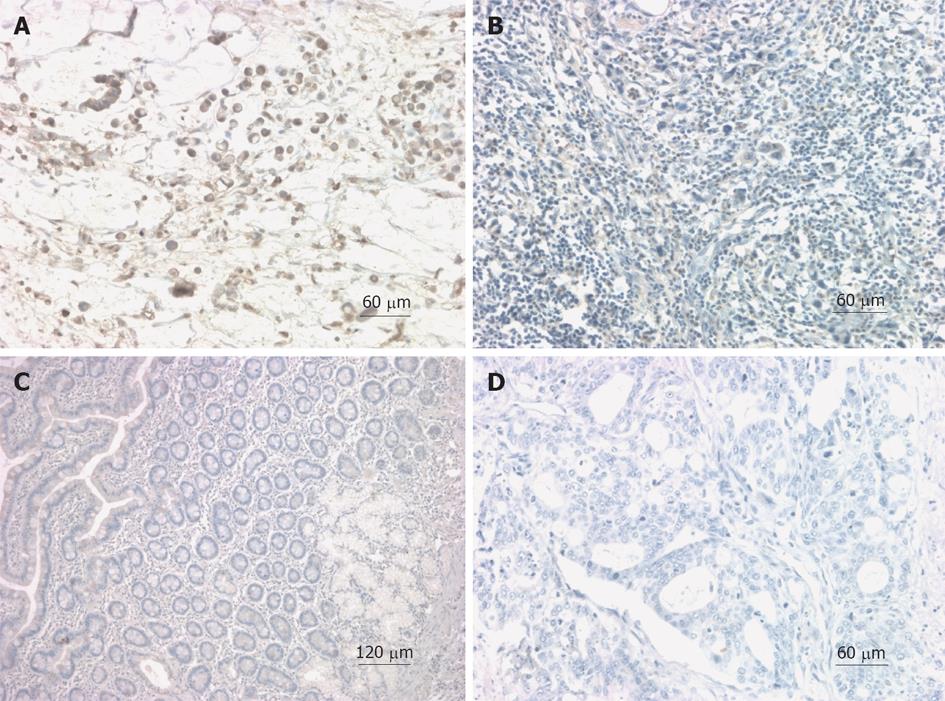
Figure 2 Expression of human kallikrein 12 protein in gastric cancer and noncancerous mucosal tissues detected by immunohistochemistry.
A: Strong positive human kallikrein 12 protein (hK12) immunostaining in gastric cancer (GC) tissues, hK12 staining was observed in the cytoplasm of cancer cells; B: Weak positive hK12 immunostaining in GC tissues; C: Negative hK12 immunostaining in relevant normal tissues; D: Negative hK12 immunostaining in GC tissues (original magnification A, B, D ×200, C ×100).
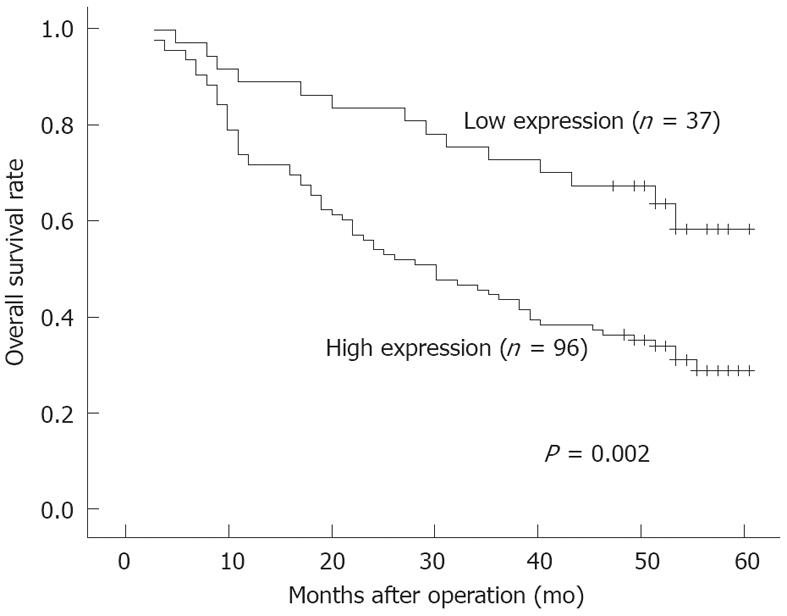
Figure 3 Overall survival of patients with gastric cancer according to human kallikrein 12 protein expression in the cancer tissues.
Patients in the high human kallikrein 12 protein (hK12) expression group had a significantly poorer prognosis than those in the low hK12 expression group. Survival curves are drawn according to the Kaplan-Meier method, using the log-rank test to compare the survival rates (P = 0.002).
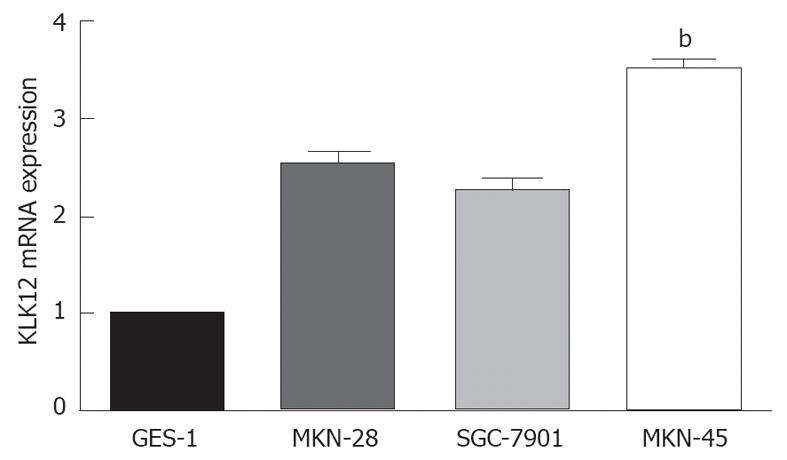
Figure 4 Expression of kallikrein 12 mRNA in gastric cancer cell lines and normal gastric mucosal cell line.
Gastric cancer cell lines show higher levels of kallikrein 12 (KLK12) mRNA expression than normal gastric mucosal cell line, while MKN-45 cells expressed the highest level of KLK12 across the four cell lines. Data are shown as mean ± SD, using the one-way analysis of variance test (bP < 0.01 vs other cell lines).
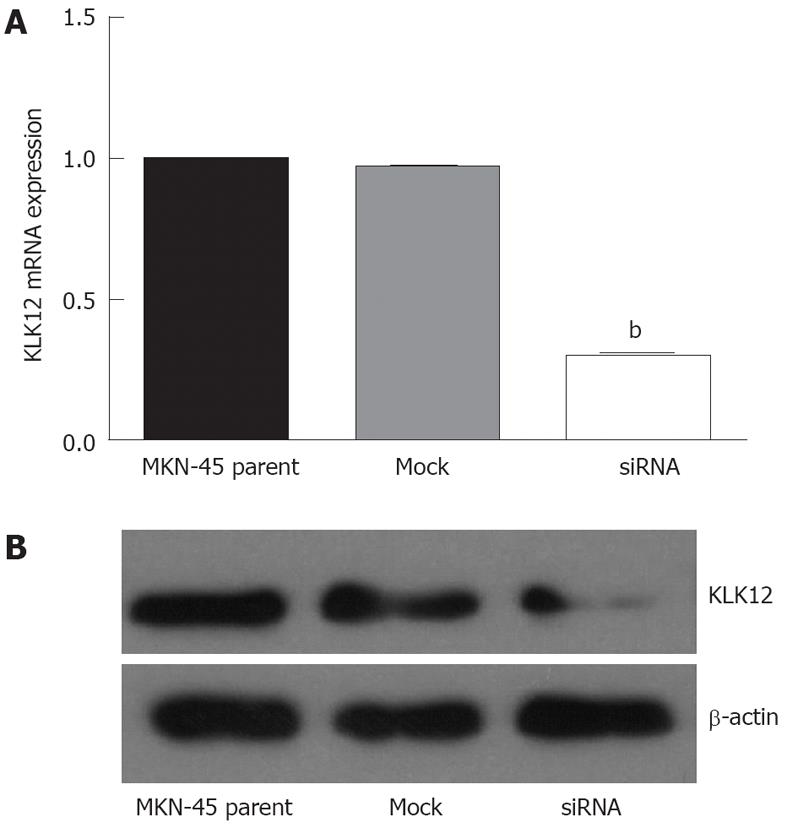
Figure 5 Efficiency of small interfering RNA in silencing the kallikrein 12 mRNA, and protein expression in MKN-45 cells.
A: MKN-45 cells transfected with small interfering RNA targeting human kallikrein 12 (KLK12) gene showed a remarkable decrease in the level of KLK12 mRNA compared to mock-transfected or parent MKN-45 cells. Data are shown as mean ± SD, using the one-way analysis of variance test (bP < 0.01 vs other cell lines); B: Western blotting analysis showed a reduced protein expression in KLK12 small interfering RNA (siRNA) transfected cells. The protein levels are measured by Image J software (National Institutes of Health, United States) with β-actin protein normalization.
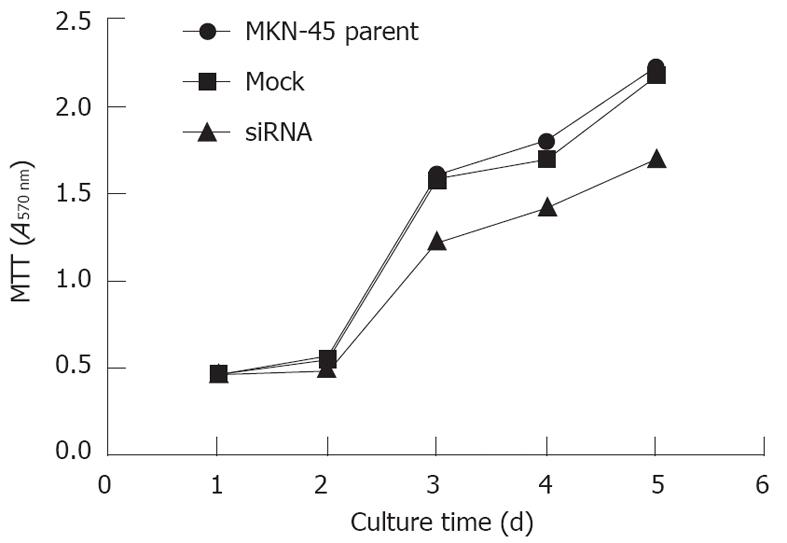
Figure 6 Reduction of cell proliferation by methylthiazolyltetrazolium assay after silencing the kallikrein 12.
The proliferative ability significantly decreased in MKN-45 cells after transfection with kallikrein 12 small interfering RNA (siRNA), especially from the 3rd to 5th days of the assay. Data are shown as mean ± SD, using the one-way analysis of variance test (P = 0.001). MTT: Methylthiazolyltetrazolium.
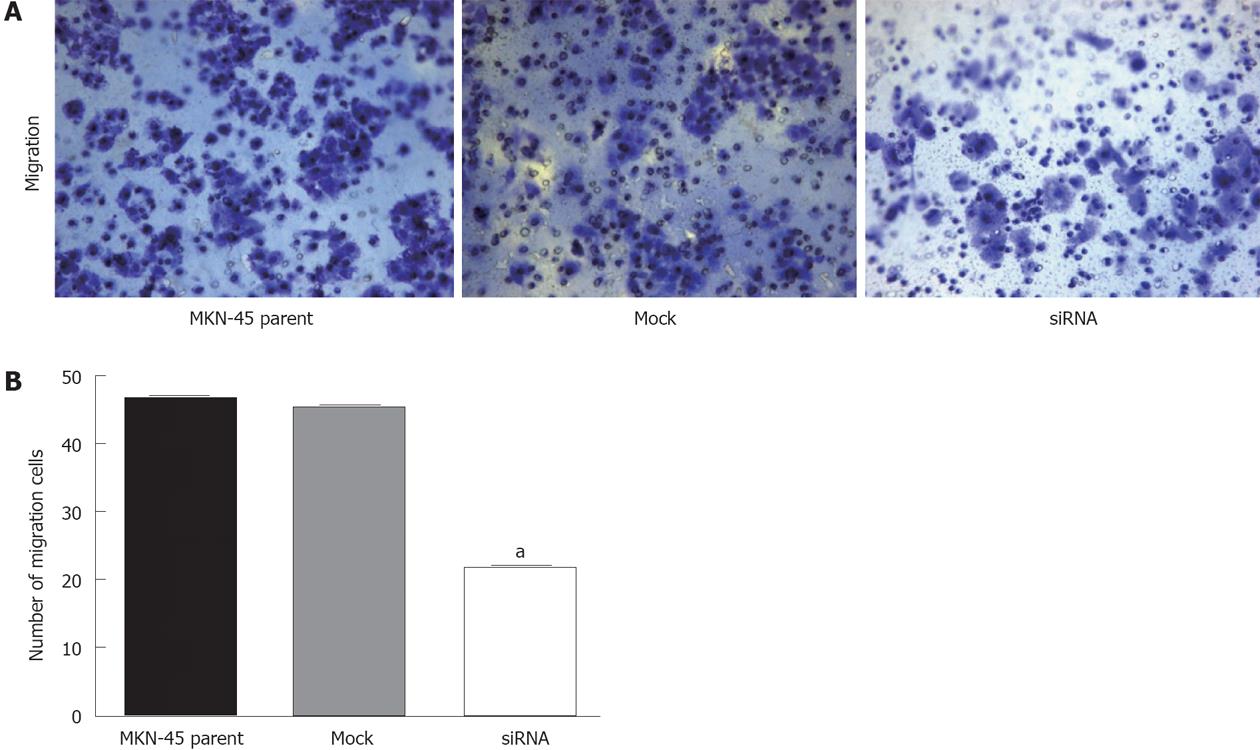
Figure 7 Effect of cell migration by kallikrein 12 knockdown.
A: 24-well transwell chambers with upper and lower culture compartments separated by polycarbonate membranes with 8-μm pores were used for migration or invasion assay. The chambers were stained by 0.09% crystal violet and cells were counted using light microscopy under high magnification (magnification ×10); B: The migration or invasion cells were counted in 5 individual fields per insert. Values were the number of cells. Data are shown as mean ± SD, using the one-way analysis of variance test (aP < 0.05 vs other cell lines).
- Citation: Zhao EH, Shen ZY, Liu H, Jin X, Cao H. Clinical significance of human kallikrein 12 gene expression in gastric cancer. World J Gastroenterol 2012; 18(45): 6597-6604
- URL: https://www.wjgnet.com/1007-9327/full/v18/i45/6597.htm
- DOI: https://dx.doi.org/10.3748/wjg.v18.i45.6597


